


Next: Mean Occupation Layer
Up: Minimal Spanning Trees
Previous: Minimal Spanning Trees
Contents
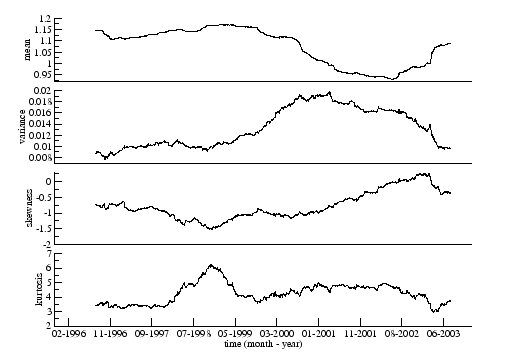
To see how the results of the MST are similar with the results from the correlation matrix, we compute the moments of the distances of the tree in time and compare with the same moments for the correlation coefficient (Figure 3.9). As expected from equation 2.24, when the mean correlation increases, the mean distance decreases and vice versa. Here, the mean and the variance of the distances of the tree are anti-correlated but the skewness and the mean continue to be anti-correlated. This means that after some negative event impacts the market, the tree shrinks, so the mean distance decreases [26], the variance increases implying a higher dispersion of the values of distance and the skewness, that is almost always negative, increases showing that the distribution of the distances of the MST gets more symmetric.
Figure 3.9:
Mean (eq. 2.25), variance (eq. 2.26), skewness (eq. 2.27) and kurtosis (eq. 2.28) of the distances of the MST constructed from time series of  stocks of the FTSE100. We use time windows of length
  days and window step length parameter
  day.
day.
 |
A MST visualisation for our study of the world indices is shown in Figure 3.10.
Figure 3.10:
MST of  countries computed from the time series of returns for each country market index. For this tree we use the full time series of
  weekly prices from
  January
  until
until  February
  . The classification is presented in Appendix B.
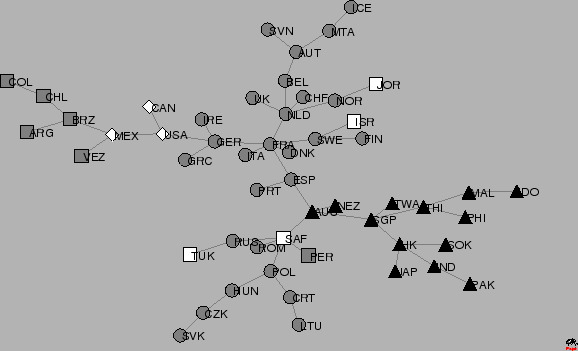 |
The clusters which we observe appear to be organized principally according to a geographical criterion. With the highest number of links, France can be considered the central node. Closely connected to France are a number of the more developed European countries. We can also identify several branches which form the major subsets of the MST and these can then be broken down into clusters. The Netherlands heads a branch that includes clusters of additional European countries. The U.S.A. links a cluster of North and South American countries to France via Germany. Australia heads a branch with several groupings: all the Asian-Pacific countries form two clusters, one of more developed and the other of less advanced countries. Most of the Central and East European (CEE) countries, that joined the E.U. in 2004, form a cluster. Jordan, which appears in a European clustering, is an apparent anomaly. This is likely due to the fact that Jordan is the last node connected to the network and has correlations with other countries close to zero, which means a relatively high minimum distance. We can conclude that Jordan is an outlier of our study that does not have any close relation to any of the other countries represented here.
Next: Mean Occupation Layer
Up: Minimal Spanning Trees
Previous: Minimal Spanning Trees
Contents
Ricardo Coelho
2007-05-08