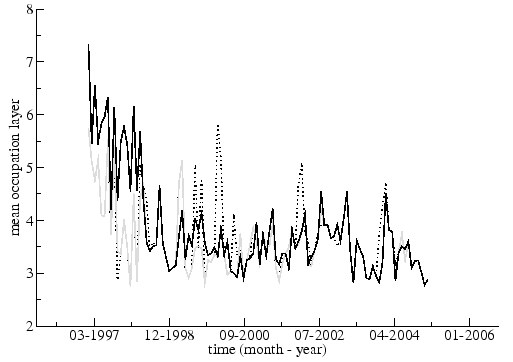
The mean occupation layer can be calculated using either a fixed central node for all windows, i.e., France, or with a continuously updated node. In Figure 3.11 the results are shown for France as the fixed central node (black line), the dynamic maximum vertex degree node (black dots) and the dynamic highest correlation vertex (gray line). The three sets of calculations are roughly consistent. The mean occupation layer fluctuates over time as changes in the MST occur due to market forces. There is, however, a broad downward trend in the mean occupation layer, indicating that the MST over time is becoming more compact.
 |