


Next: Minimal Spanning Trees
Up: Results
Previous: The correlations of stock
Contents
Comparing the probability density functions of eigenvalues of random matrix,
 with the real correlation matrix,
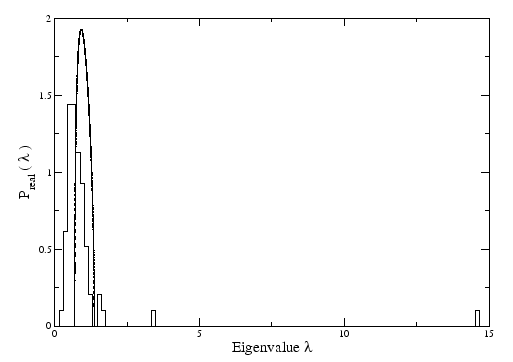
 we can see that some eigenvalues are way out of the spectrum of the random matrix (Figure 3.3). We can regard this as the information of the market that is not random. All the eigenvalues that are outside the region defined by random matrix theory contain information that can be revealed when we look closer at the respective eigenvectors.
Figure 3.3:
Empirical spectrum of the eigenvalues of correlation matrix constructed from time series of  stocks of the FTSE100, compared with the analytical spectrum of the random matrix, equation 2.14 (bold curve).
 |
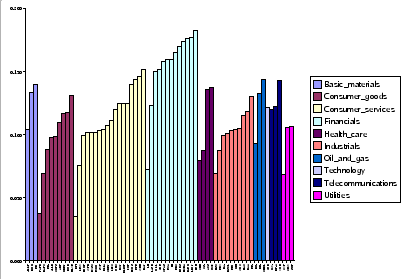
The elements of the eigenvector related with the largest eigenvalue are represented in Figure 3.4 and as we can see, they all have the same sign.
Figure 3.4:
Elements of the highest eigenvector of the real correlation matrix constructed from time series of stocks of the FTSE100.
 |
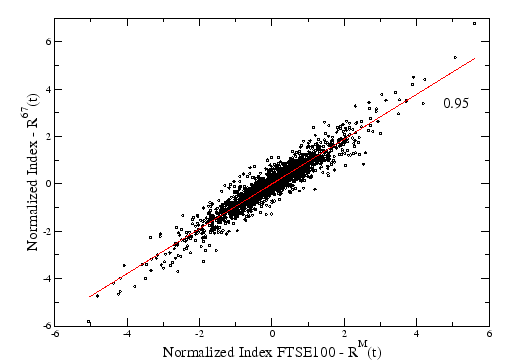
Comparing the market mode constructed from this eigenvector (equation 2.16) with the real index of the FTSE100, we can see a very high correlation of  (Figure 3.5).
Figure 3.5:
Returns of the portfolio of stocks of FTSE100 using the definition of equation 2.16 against the real index of FTSE100 in time. The correlation between them is high, .
 |
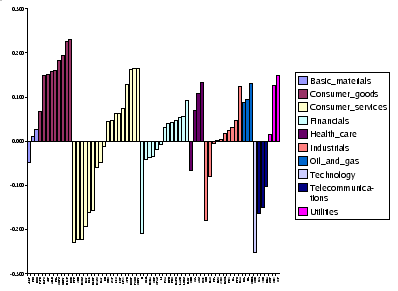
Analysing the eigensystem of the residual matrix ( ) we conclude that the eigenvector of the highest eigenvalue (Figure 3.6) is the same as the second eigenvector of the original matrix. So, we conclude that we are able to filter the influence of the market from our time series. This eigenvector has information about the sectors. Stocks from the same sector that have different signs are not clustered together when we see them in the MST (Figure 1.4), but if they have the same sign they form a cluster. We can see that these companies belong to different sub-sectors (Appendix B).
Figure 3.6:
Elements of the highest eigenvector of the correlation matrix of residuals ( ) constructed from filtered time series of stocks of the FTSE100.
 |
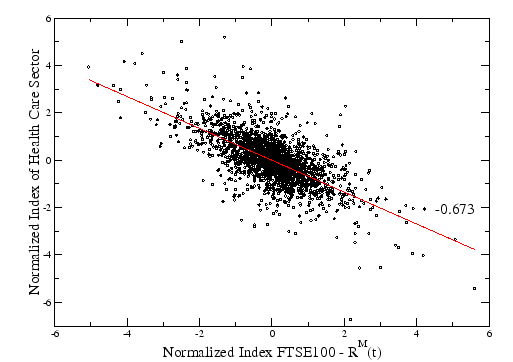
The correlation between the sector mode and the real index, FTSE100 is different for different sectors. For example, Financial has a large correlation of  , but Health Care have a negative correlation of
  , as we can see in Figures 3.7 and 3.8.
Figure 3.7:
Returns of the portfolio of the stocks of FTSE100 that belong to Financial Sector using the definition of equation 2.16 against the real index of FTSE100 in time. The correlation between them is high, .
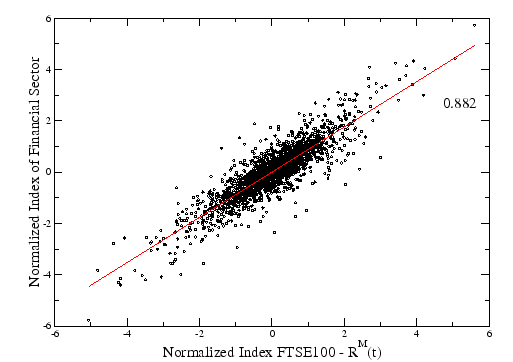 |
Figure 3.8:
Returns of the portfolio of the stocks of FTSE100 that belong to Health Care Sector using the definition of equation 2.16 against the real index of FTSE100 in time. They are anticorrelated with a value of .
 |
Next: Minimal Spanning Trees
Up: Results
Previous: The correlations of stock
Contents
Ricardo Coelho
2007-05-08