Some of the conceptual difficulties experienced when attempting to
model this phenomenon and analyse the data were in part due to
jumping to conclusions when presented with data. In the literature
the total length of cracks is commonly analysed. This is how the
data was analysed for the growth model. When turning the focus to
the coalescence problem the initial raw data that was received
from the engineers was reordered, after some consideration, as
described in Table ![]() . Then the data
. Then the data ![]() are a
collection of lengths
are a
collection of lengths ![]() for each crack i, of a total
of I cracks, observed at some or all of the times
for each crack i, of a total
of I cracks, observed at some or all of the times ![]() . Not all cracks existed at all times, that is, it was
possible that the cracks had been involved in coalescence, in
which case, the later timepoints would not be relevant, or that
the crack had not yet been formed, in which case the earlier
timepoints might not be relevant. For the subset of the data
included in Table
. Not all cracks existed at all times, that is, it was
possible that the cracks had been involved in coalescence, in
which case, the later timepoints would not be relevant, or that
the crack had not yet been formed, in which case the earlier
timepoints might not be relevant. For the subset of the data
included in Table ![]() there are three cracks, and four
timepoints. The data consist of;
there are three cracks, and four
timepoints. The data consist of;
![]()
since the
first and second crack coalesce between the first and second
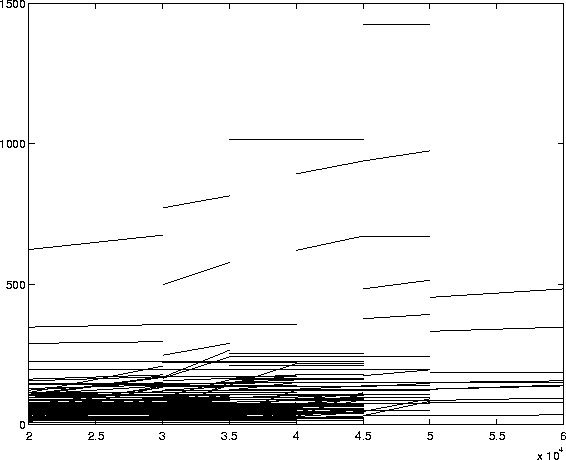
timepoint. When the 200kN data is so arranged an alternative plot
of the data, as compared with Figure ![]() is
obtained. This is plotted in Figure
is
obtained. This is plotted in Figure ![]() .
.

Figure: Plot of 200kN Data, Coalescence Taken into Account
Thus, the number of coalescences, the time interval during which the coalescences took place, the lengths of cracks at the observation time before and after coalescence, together with the details of which crack coalesced with which, form the set of data. Clearly, one may be interested in the context of the modelling problem in the actual time of coalescence and the lengths at coalescence, and while these are not observed, it is still possible to make probability statements about them.