Spatial data would allow a fuller analysis of the problem, and
would allow a spatial model to be applied. However, detailed
spatial data was not recorded. When a crack was involved in
coalescence, all that was known was that a number of cracks
existed before time ![]() and at time
and at time ![]() a single crack
remained. The lengths of the constituent cracks, together with the
length of the final crack were also recorded.
a single crack
remained. The lengths of the constituent cracks, together with the
length of the final crack were also recorded.
The form of the data was ![]() where there were a total of I cracks recorded at J
timepoints. If the data regarding lengths is ignored for the time
being then a pattern of coalescence may be observed.
where there were a total of I cracks recorded at J
timepoints. If the data regarding lengths is ignored for the time
being then a pattern of coalescence may be observed.

Figure: Data, Transformation
and Mechanism
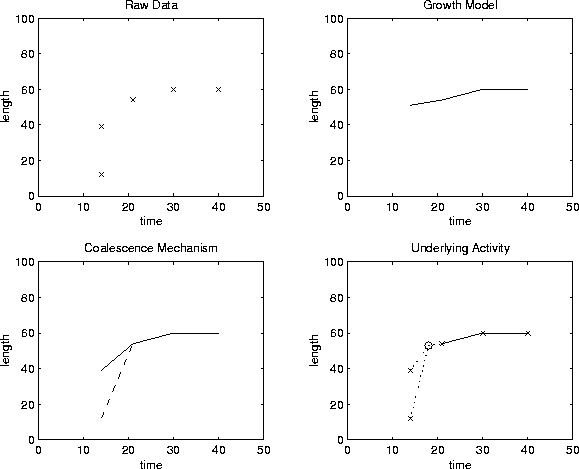
Figure ![]() shows the various interpretations of the
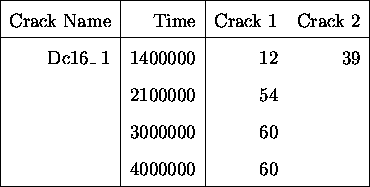
data. This data is for crack Dc16_1 from data at 140kN, as
described in Table
shows the various interpretations of the
data. This data is for crack Dc16_1 from data at 140kN, as
described in Table ![]() . The upper quadrant is a plot of
observed raw data versus number of cycles. The observed data are
marked with an `x'. The second plot is of the data used for the
growth model. This reflects the transformation of the data as
described in Section
. The upper quadrant is a plot of
observed raw data versus number of cycles. The observed data are
marked with an `x'. The second plot is of the data used for the
growth model. This reflects the transformation of the data as
described in Section ![]() .
.
The third plot demonstrates one way in which to think of coalescence. One considers that the first of the two cracks `disappears' with the second crack taking on a corresponding elongation and subsequent growth. This is shown on the plot with a solid line for the second crack, and a dotted line for the first crack, which disappears at the coalescence time. The question of identifiability complicates issues for this case.
The fourth plot represents the way in which we considered the data after many attempts at modelling the situation. All that is really known is the following;
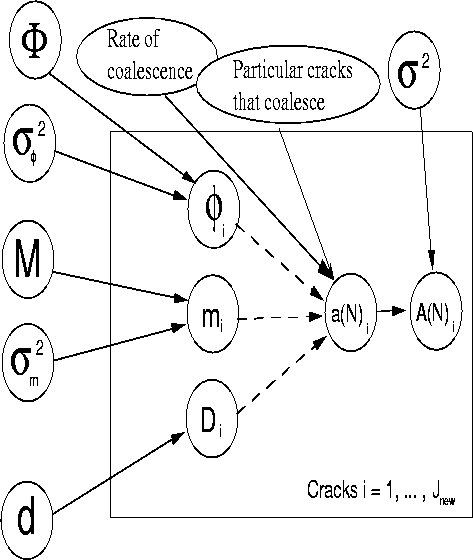
By considering the data as a set of cracks which grow during time,
and which die at coalescence, it is possible to consider the
growth being independent of coalescence. Coalescence is the birth
and death effect, whereas the growth effect results only in
elongation as previously examined. Graphically, this idea may be
represented in a DAG (see Figure ![]() .)
.)

Figure: DAG to Represent Joint Activity.
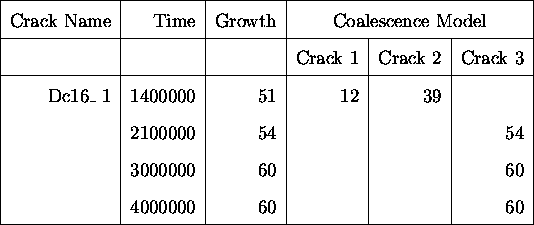
Tables ![]() and
and ![]() show the treatment of
the crack data. Instead of considering the cracks as one single
crack (growth model) or a combination of cracks, one of which
grows, they are considered as cracks which die at coalescence,
with a new crack forming. That is, in this case, there are three
cracks to consider; two initial cracks and a third crack which is
born at the time of death of the other two.
show the treatment of
the crack data. Instead of considering the cracks as one single
crack (growth model) or a combination of cracks, one of which
grows, they are considered as cracks which die at coalescence,
with a new crack forming. That is, in this case, there are three
cracks to consider; two initial cracks and a third crack which is
born at the time of death of the other two.

Table: Data as Provided by Engineers
for a Case where 2 Cracks Coalesce.

Table: Data in the Form in which
it was Used for the Growth and Coalescence Model Respectively.