3.5 Rotational transitions in the C60 thin film
The study of phase transitions in two-dimensional (2D) systems is an active area
of research due to their potential applications, such as improving the
performance of liquid crystal opto-electronic devices [121] and high-TC
superconductors [122, 123], and determining the thermodynamic properties of
nanoparticles [124]; and also due to the fundamental physics at play such as the
crystal structure of novel intermetallic compounds [125]. There are major
differences between phase transitions in 2D and 3D systems [126–129]. For
example, melting in 3D crystals is always a first order transition, whereas in 2D
systems this is not necessarily the case.
In the close-packed, two-dimensional layer of C60 molecules, individual
molecules are weakly bonded to their nearest neighbors. If each molecule in such a
monolayer could be addressed individually, this could provide the basis for a
device with an ultra-high element density. The properties of such devices are
determined by the behavior of both the individual molecules and the C60 layer as
a whole.
The unique properties of fullerenes and fullerene-based compounds result from
the structure and shape of the C60 molecule. The symmetry of the molecule and
its deviations from a uniform spherical shape give it rotational degrees of freedom,
which often determine the physical properties of C60 compounds, C60-based
clusters, 2D layers and the 3D crystal. At room temperature, C60 molecules
arranged in a face-centred cubic lattice (FCC) undergo rapid rotation around
their centers of mass. The typical time for a single molecular rotation is in the
range of 3 picoseconds [130].
Below 259 K, however, ordering occurs, resulting in a change of space
group symmetry from FCC to simple cubic [131–133]. Neutron scattering
studies [132, 134] have shown that between 90 K and 259 K, C60 molecules in the
3D crystal shuffle between two nearly degenerate orientations, which differ in
energy by 11 meV. The orientations are separated by an energy barrier of
290 meV [135, 136].
There is a glassy transition in the 3D crystal at 90 K, resulting from a freezing
of the molecules’ hopping between the two orientations [137]. The relaxation time
is estimated to be about 1 day at 90 K [138, 139]. The relaxation process
around the glassy transition can be fitted by a non-exponential function
exp{−(t∕τ)β} [137], where β = 0.94 [139]. The deviation of the relaxation
dependency from a simple exponential (β = 1) curve provides evidence for
significant interaction between the molecules.
The rotational phase transition in an 80 nm, single-crystalline C60 film
deposited on GaAs(111) has been previously studied by X-ray diffraction [140].
The results of these measurements reveal an anomaly in the lattice parameter at
the phase transition temperature TC = 240K, 19 K below that of the bulk C60
crystal. This difference was attributed to a strain effect in the C60 film introduced
by the substrate.
Mean field theory has been used to model the interactions of solid C60, both at
the surface of the crystal and in the bulk, and these calculations have been
confirmed by experimental results. In solid C60, melting of the orientational order
starts from the top layer of the surface. Lu et al. [138] and Lamoen and
Michel [141] have each modelled the interactions in bulk C60 using mean
field techniques, and were able to reproduce the experimentally-observed
crystal symmetries, including the phase transition from a low-temperature
simple cubic structure to a disordered face-centred cubic structure at
260 K.
Passerone and Tosatti [142], and Laforge et al. [143] later built upon these
models to describe the rotational surface disordering phase transition for the (111)
surface of solid C60, for which three separate phases are predicted and observed.
Below 150 K, the surface has (2 × 2) symmetry. Three molecules in the
surface (2 × 2) unit cell have only a twofold axis normal to the surface. The
fourth, more frustrated molecule has instead its threefold axis normal
to the surface. Between 150 K and 230 K, the surface symmetry is still
(2 × 2), but the more frustrated molecule begins to rotate, and above 230 K,
all surface molecules are in the disordered state, with (1 × 1) surface
symmetry.
This section is focused on the link between an individual molecule’s transitions
between different states and the phase transition of a statistical ensemble of C60
molecules forming a single molecular layer on the WO2/W(110) surface in the
temperature range between 78 K and 320 K. A rotational phase transition at
259 K and a kinetic glassy transition at 220 K have been observed. A good
agreement between the parameters of the observed rotational transitions and
those predicted from the properties of individual C60 molecules has been
found.
3.5.1 Temperature dependence
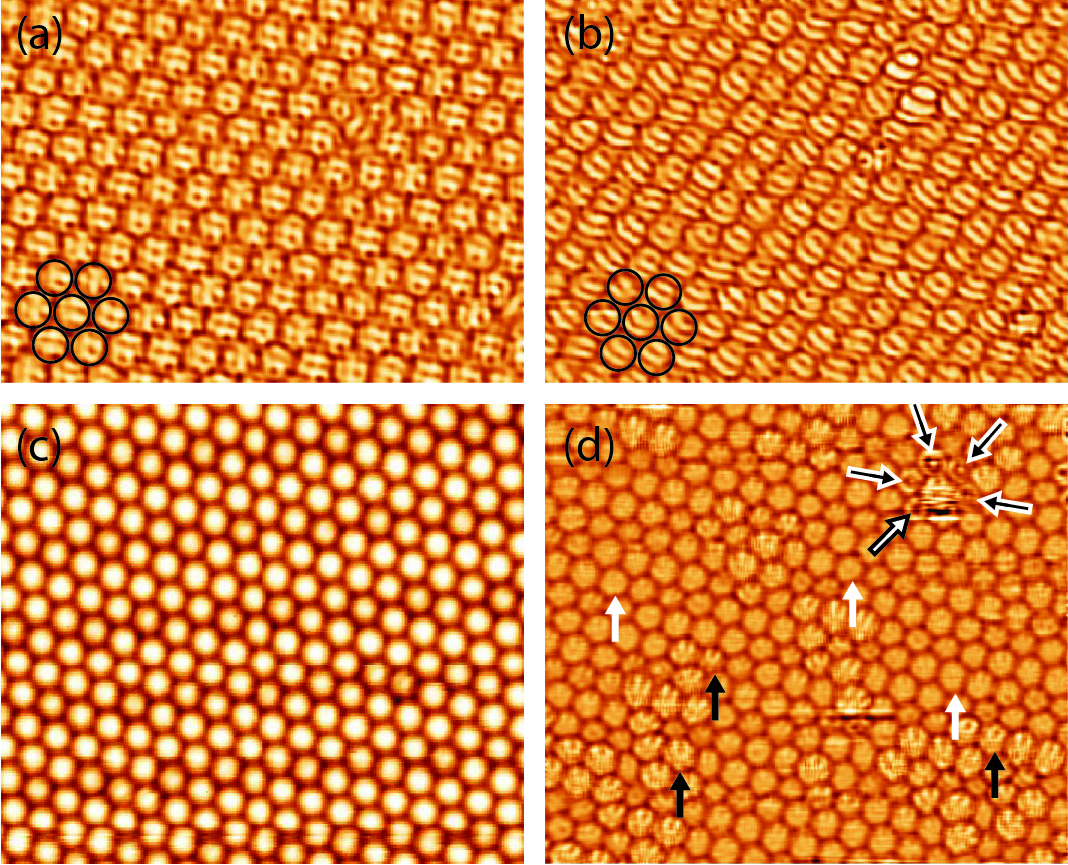
At low temperatures (below 220 K), STM images of individual molecules reveal an
orbital structure that is determined by the orientation of the C60 molecule
(Figure 3.12a, b). The arrangement of the molecular orbitals depends on the
cooling regime. When the sample was quenched with a cooling rate of 10 K/min,
it formed the orbital structure presented in Figure 3.12a. This structure is
characterized by a random orientation of C60 molecules forming a glassy,
metastable state. No correlations between the individual orientations of
neighboring C60 molecules have been found.
The orbital arrangement shown in Figure 3.12b was realized by slowly cooling
the film, at a rate of 100 K/day, from 300 K down to 78 K. The molecular orbitals
of individual C60 appear in the STM image of the orbital-correlated state as
stripes aligned in approximately the same direction (Figure 3.12b). Almost all C60
molecules in Figure 3.12b exhibit this striped structure, which indicates that
these molecules face the substrate with an h–h bond [46]. Such an approximate
orbital alignment has been observed both along and perpendicular to a
close-packed direction of the molecular layer. As the state shown in Figure 3.12b
results from slow cooling, it would suggest that the alignment with the h–h bonds
facing the substrate has lower energy than the glassy, metastable state obtained
by quenching the sample. In this chapter, common notations for states
characterized by different bonds between C60 and the surface are used: h, h–h, p,
h–p, and s.
At a temperature of 78 K, the majority of the molecules retained their orbital
structure and they were static for the duration of the experiment (up to
several days), regardless of whether they were in the h–h or h–p state.
In contrast, at high temperatures (T > 259K), the orbital structure of
individual C60 molecules is no longer visible in STM images (Figure 3.12c)
due to the molecules’ rotation, which is faster than the time resolution
of the STM. All C60 molecules appear in these STM images as perfect
spheres.
At intermediate temperatures (220–259 K), both static and rotating molecules
appear in the STM images (Figure 3.12d). In the temperature range
220–259 K the fraction of static molecules rapidly decreases with increasing
temperature.
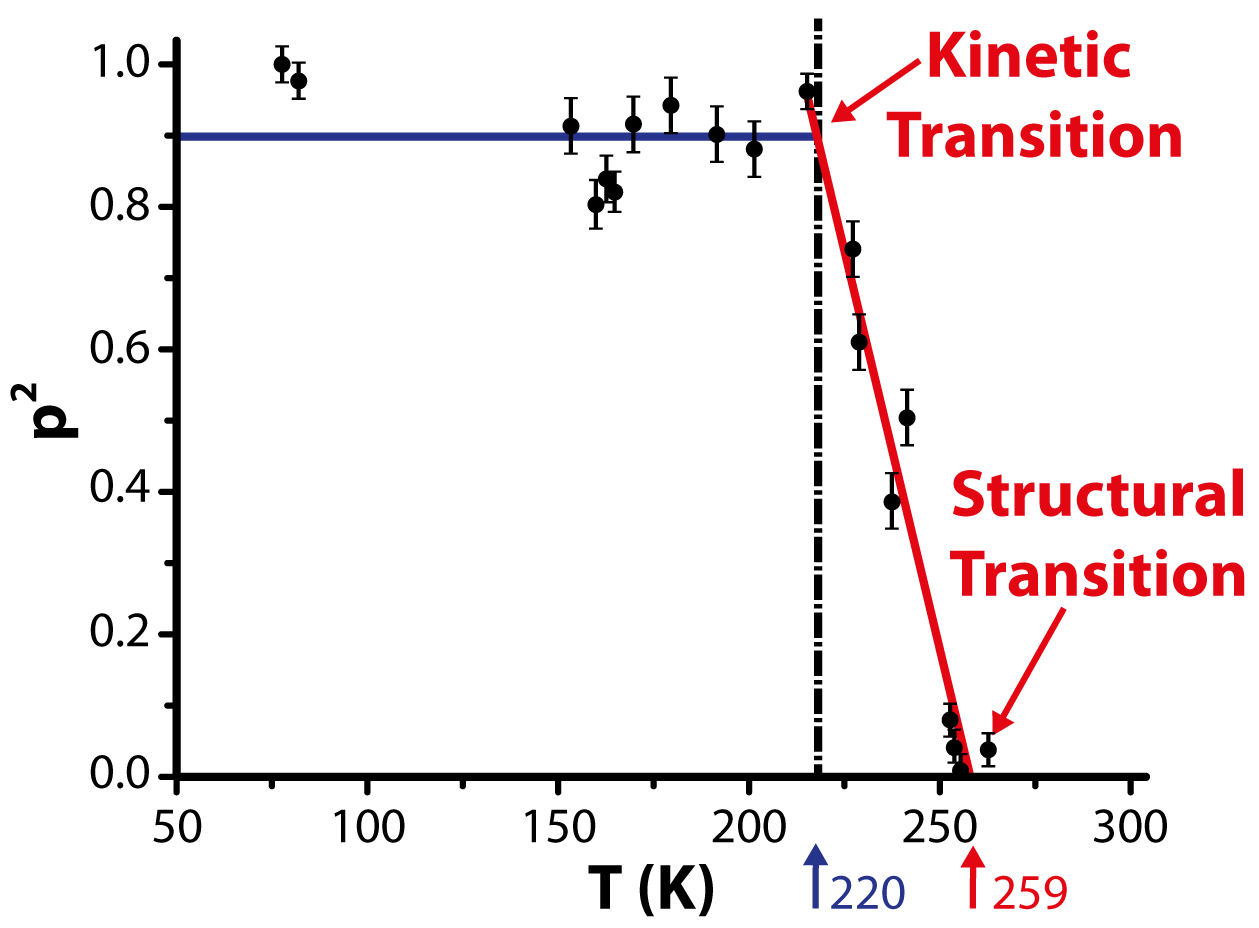
At T < 220K, almost all molecules exhibit the orbital structure. The few
anomalies are likely caused by defects on the surface. Figure 3.13 shows
the temperature dependence of the square of the probability of finding
a static C60 molecule, p2, to demonstrate the observed transitions and
reveal the order parameter η. Each point in Figure 3.13 corresponds to
several large-scale STM images of the C60 film at that temperature (of
similar size to Figure 3.12d), and p is calculated by counting the number of
static molecules in an image and dividing by the total number of visible
molecules.
According to Landau’s theory of phase transitions, the order parameter η is
proportional to (TC −T)1∕2. At low temperatures (T < 220K), p2 is constant with
respect to temperature, but does not quite reach unity, since the few molecules
close to the defects appearing in the STM images were not included in the number
of static molecules. The horizontal blue trend line shown is a fit to the data, with
its slope set to 0.
In the temperature range from 220–259 K, p2 is fitted by a linear function
p2 = α(T
C − T), where α = 0.022 ± 0.002K-1 and TC = 259K. TC indicates
the temperature of the rotational phase transition. The glassy transition
at Tg = 220K is a kinetic transition, at which the molecular switching
rate between different states becomes slower than the time scale of the
experiment. Below Tg, the C60 molecules’ nanomotion becomes virtually
frozen and orbital-resolved STM images of individual molecules do not
change.
3.5.2 Molecular transitions between different states
Orbital-resolved STM images of C60 present a unique opportunity to study the
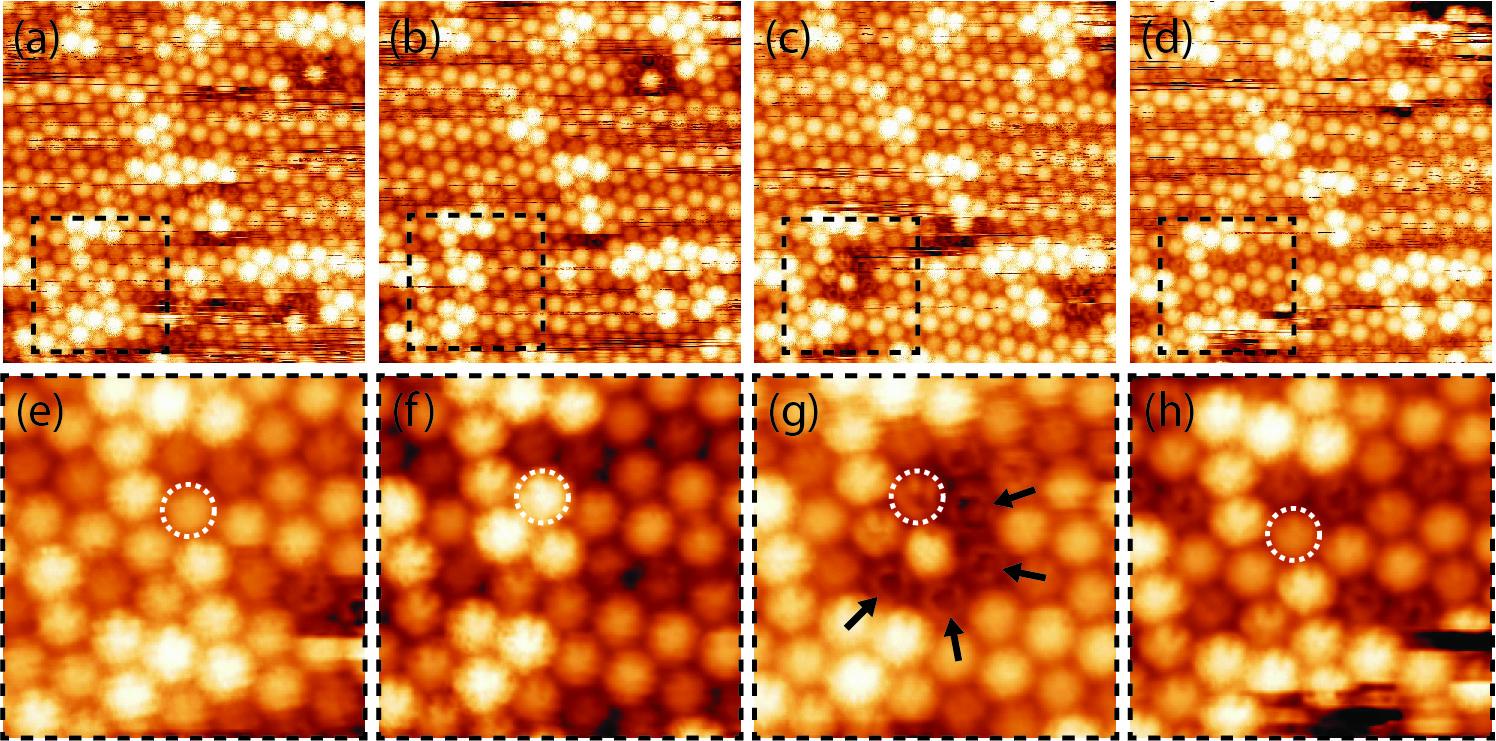
rotational transition mechanism on a molecular scale. Figure 3.14 shows a
consecutive set of STM images of the C60 monolayer measured at T = 256K, in
the vicinity of the rotational phase transition, (TC − T)∕TC = 0.012.
The STM images presented in Figure 3.14a–h indicate how C60 molecules can
switch between several different states, leading to changes in their appearance.
Some molecules switch between a high- and a low-conductance state, observed in
STM images as a repetitive switching between a bright and dark appearance. This
will be explored in detail in Section 3.6. Furthermore, static molecules exhibit an
orbital structure [46], while those with high-magnitude oscillations and molecular
rotation appear blurry in STM images.
Panels e–h show a zoom of the area marked by a dashed box in panels a–d.
A single molecule which switches between states in subsequent scans is
shown by a dashed circle. The mechanism of a molecule’s switching is
connected to its rotation, accompanied by charge transfer to or from the
molecule, leading to it becoming polarized [144, 145]. The molecules can also
switch between static (orbitals resolved) and dynamic (orbitals blurred)
states.
We also observe molecules that appear in the STM images as a ring shape, or
a ring with a protrusion at the centre (Figure 3.12c, Figure 3.14e, f, h).
Such shapes can be explained by the molecules spinning around their axis
perpendicular to the surface. This is shown in detail in Figure 3.17. Arrows
in Figure 3.14g indicate several such spinning molecules exhibiting the
ring shape appearance. These molecules do not spin in Figure 3.14e or
Figure 3.14f.
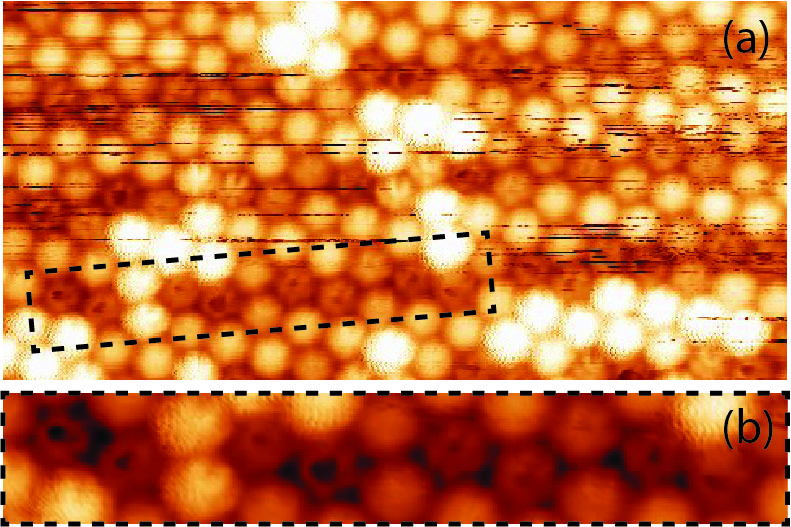
From the analysis of an extensive number of STM images it was found
that, in many cases, the switching of one molecule into a bright state
can trigger the spinning of its nearest neighbors. It was also observed
that spinning molecules tend to occupy positions along the grooves of the
WO2/W(110) substrate, as shown in Fig. 3.15. This suggests that the energy
levels of the C60 molecules are affected by the substrate and also that the
molecular states can be made more stable or less stable depending on
the position of the molecule within the unit cell of the WO2/W(110)
structure.
Therefore, in addition to the transition between different orbital states, there
are transitions between the static state of the molecule and spinning state
(in-plane rotation). Such phenomena are only observed for isolated molecules and
molecular clusters in the monolayer, and so are not caused by molecular transfer
to the tip or other tip effects, because if that were the case, the tip would affect all
molecules being imaged.
3.5.3 DFT calculations of C60 orientation & spinning molecules
DFT was performed using the VASP code and LDA pseudopotentials. The choice
of LDA is justified, as it has been shown that DFT-LDA has given excellent
results for the total energies and band structures of fullerites and other
carbon-based structures (graphite, nanotubes) [146–151].
Girifalco and Hodak state that first-principles calculations for graphitic
structures can be carried out quite successfully, but they are sensitive to the
details of the calculation, and long-range dispersion interactions, such as van der
Waals forces, should be included for separation distances greater than 1.15 of
the equilibrium separation [152]. However, the separation distance of
C60–C60 on the WO2/W(110) surface is 9.5 ± 0.5 Å, which is less than the
intermolecular distance of 10 Å in the bulk C60 crystal. This strongly
suggests that van der Waals interactions can be neglected for the system
under investigation in this thesis, and that DFT-LDA calculations are
sufficient.
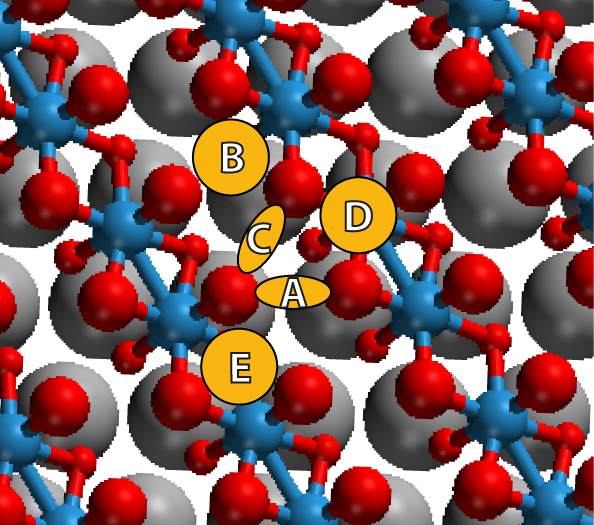
To find the optimum surface site of a single C60 molecule on one layer of WO2,
several different surface sites (labelled A, B, C, D and E in Figure 3.16)
were sampled and the total energy of those systems was calculated. The
system was found to have the lowest ground state energy when the C60’s
surface-facing C–C bond bridged two surface oxygen atoms, each of which was
bonded to a different tungsten atom (site A). This site was chosen for all
further calculations, and in order to further minimize the energy of the
system, different orientations of C60 on this site were simulated. For all
orientations, the C60 molecule was allowed to relax on a constrained layer of
WO2.
DFT calculations of the total free energy reveal that the h–h configuration
corresponds to the lowest energy state. The h–p configuration is separated
from the lowest energy state by 17 meV, which is comparable to kBT
in our STM experiments. The energy gap between the p and the h–h
configurations is about 90 meV. The h and s configurations are the least
favorable, being separated in energy from the h–h configuration by 360 meV
and 420 meV respectively. The partial charge density of each of these
systems was calculated in the range from EF to 1 eV, where EF is the Fermi
energy.
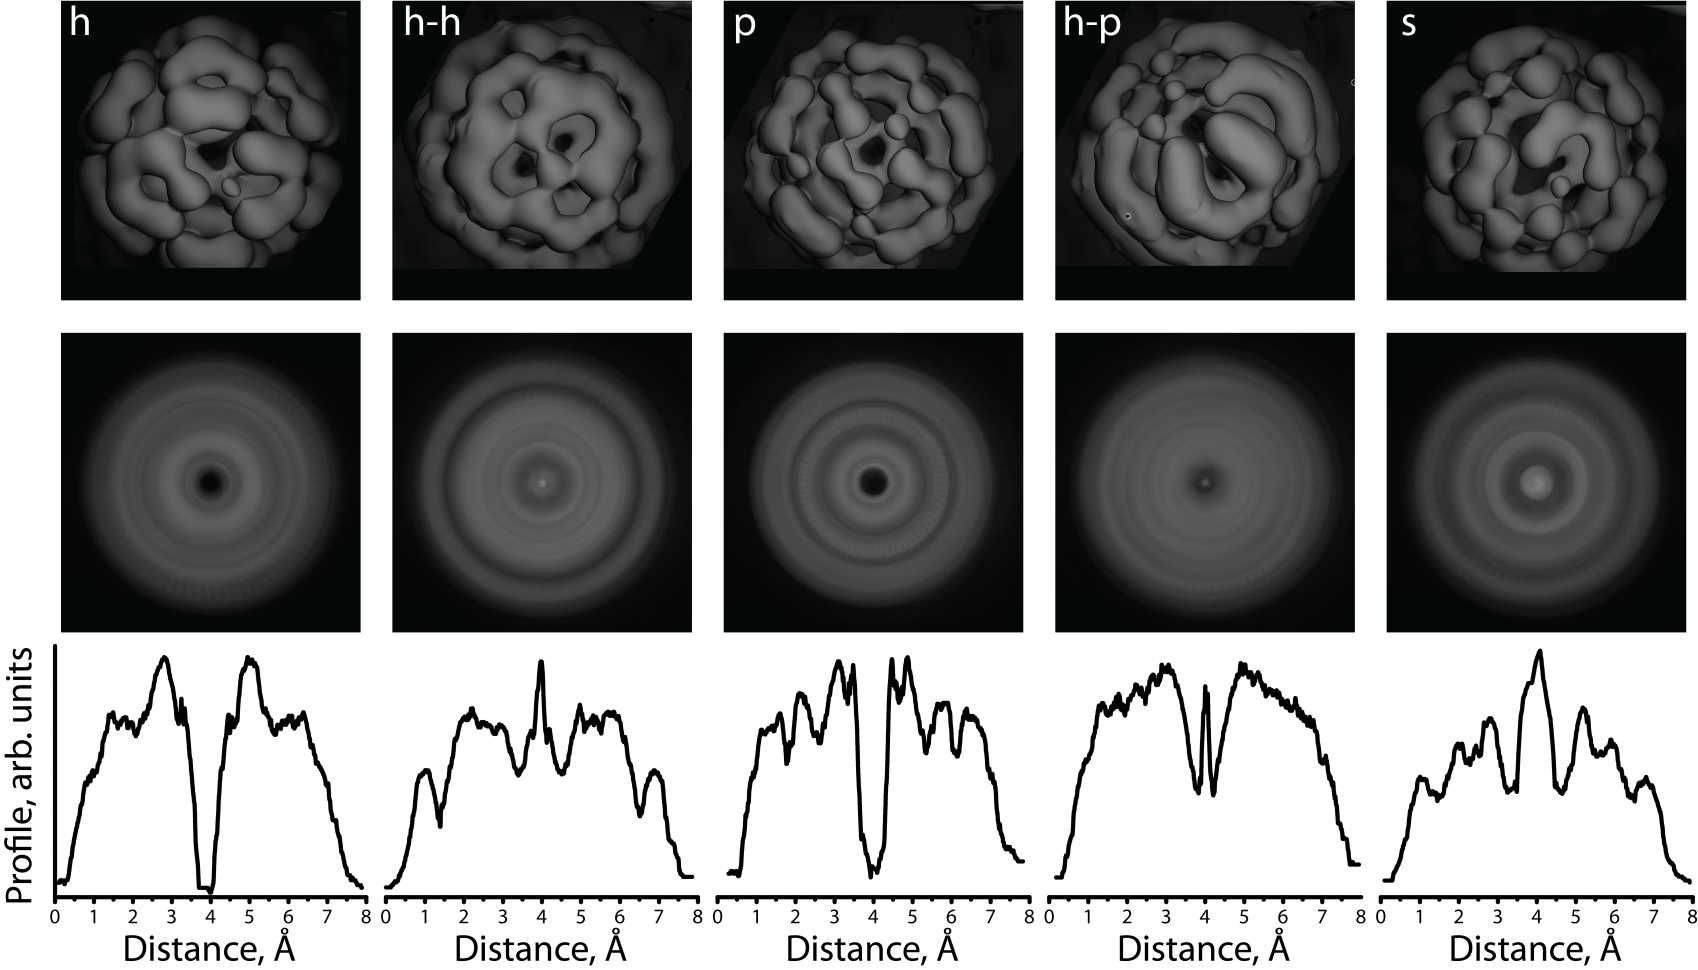
Figure 3.17: First row: DFT simulations of the partial charge density
distribution of electron states of static C60 molecules facing the substrate
by different parts of the molecule. h and p configurations correspond to the
molecule facing the substrate by a hexagon or a pentagon, respectively. In
h–h and h–p configurations, C60 faces the surface by the C–C bond shared
between two hexagons or a hexagon and a pentagon, respectively; and in the
s configuration, C60 faces the surface by a single atom. Second row: Images
obtained by rotating the charge distributions in the top panel in increments
of 5 degrees. These represent the weighted electron density of a molecule in
a particular configuration with the additional degree of rotation around the
axis perpendicular to the substrate. Third row: Cross-sections through the
rotated charge distribution shown in the second row.
The obtained charge distribution images (Figure 3.17, first row) were then
processed by rotating them in increments of 5 degrees. The resulting rotated
images (Figure 3.17, second row) were combined to form a single composite
weighted image for each orientation. This represents a molecule spinning too
fast for the STM probe to resolve. The charge distribution images for
h and p orientations reveal a dip at the center of the molecular image
while for h–h, h–p and s orientations, the ring shape of the molecule is
accompanied by a protrusion at the center. Cross-section profiles of these
simulated spinning molecules are shown in Figure 3.17 for comparison with
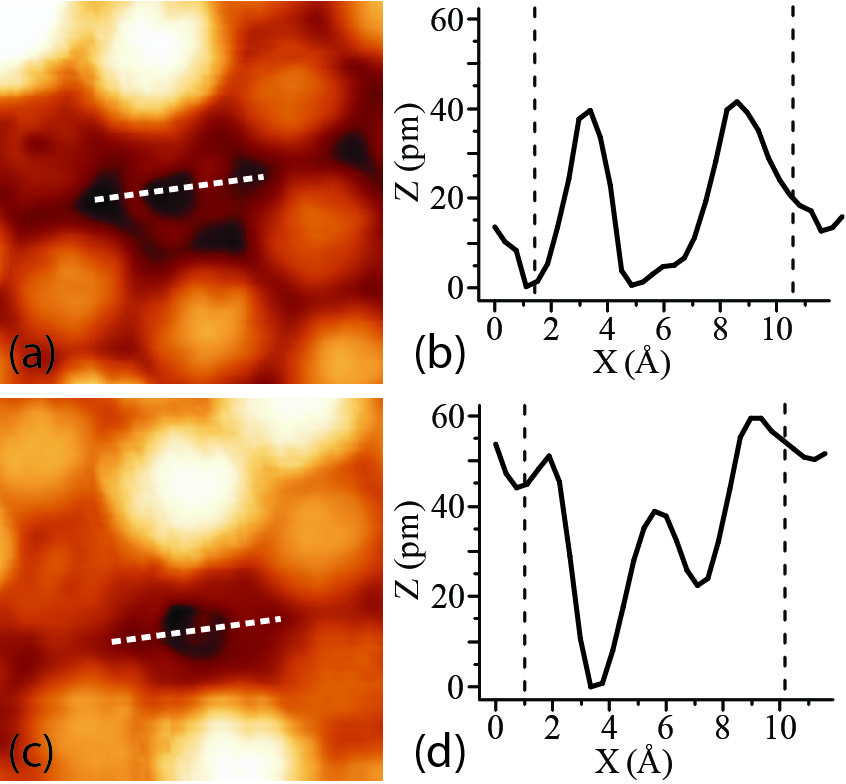
experiment. STM images of individual spinning molecules were found to have
either a ring shape with a dip/dent (Figure 3.18a) or a protrusion in
the centre (see molecules indicated by black arrows in Figure 3.12c and
Figure 3.18c).
Cross-sections of typical STM images of the spinning C60 molecules are
presented in Figure 3.18. Panel (b) corresponds to the dip at the centre while (d)
corresponds to the protrusion. About 90% of the examined STM images of
spinning C60 molecules reveal a protrusion at the centre of ring shaped images.
According to DFT calculations, h–h and h–p orientations are most favorable in
energy. Thus, we conclude that most of spinning molecules face the surface by
C–C bonds. The STM image presented in Figure 3.18 with a dip at the center of
the molecule is most likely due to a spinning molecule with a pentagon facing the
substrate.
The peak-to-peak diameter of the holes has been observed to vary
between approximately 3–6 Å, and the diameters of the experimental
cross-sections in Figure 3.18 are approximately a factor of 2 larger than
those calculated in Figure 3.17. This difference, and the distribution of
diameters, is attributed to molecular movement on the surface, such as
the precession of the spinning axis around the surface normal, for which
different precession angles will alter the apparent size of the hole by different
amounts. The h and s configurations of the molecules are unlikely to be
observed to spin under the present experimental conditions because of the
large gap in energy from the ground state. Thus the model suggests that
a spinning molecule presents a reasonable explanation for the unusual
appearance of the C60 molecules observed in the temperature range of
220–259 K.
3.5.4 Phase transition
In the three-dimensional C60 crystal, two transitions are associated with molecular
rotation: a first-order transition that takes place at 259 K and a kinetic glassy
transition at 90 K [130–136]. Above 259 K, the molecules freely rotate. At lower
temperatures, the molecules hop between two orientations separated in
energy by about 11 meV. At 90 K, the C60 crystal undergoes a glassy
transition when the equilibrium relaxation time τ exceeds the laboratory
experiment time. τ was estimated to change from 1 second to 1 day
between 130 K and 90 K, with a relaxation activation energy, Wτ of about
290 meV [138].
We found that at T > 259K, the C60 molecules in the monolayer deposited on
the WO2/W(110) surface freely rotate (Figure 3.12d), similar to behaviour
observed in solid C60. In contrast, at lower temperatures (T < 259K) we found
significant differences between the monolayer and bulk C60. However, it is
surprising that the temperature of the rotational phase transition in the
C60 monolayer on the WO2/W(110) surface coincides with that of solid
C60.
When very close to the phase transition temperature, fluctuations appear in
the form of blinking or spinning molecules. Hence, close to TC there will
be inhomogeneity introduced by these fluctuations but not necessarily
large regions of instability, similar to how orientational melting begins at
the surface of bulk C60 [143]. The amount of these fluctuations decays
exponentially away from TC, and at low temperatures the film looks homogeneous
(Figure 3.12b).
According to mean field theory [153], the temperature of a phase transition,
TC = E∕2kB, is determined by the total energy of interaction between the
molecule and its neighbors. In a C60 monolayer, this is determined by the C60’s
interaction with its neighboring molecules, the C60–substrate interaction and the
crystal field. The interaction between C60 molecules has been studied using several
models. Calculations [154, 155] reveal that, in the case of C60 molecules
separated by 1 nm, a distance comparable to the separation between molecules’
centres in a monolayer, the dominant contribution is due to the Coulomb
interaction between the molecules’ respective charge densities. These calculations
show that several combinations of orbital configurations of two adjacent C60
molecules are close in energy.
The coordination number of a C60 molecule in a monolayer is halved to 6,
compared to the 12-fold coordinated FCC bulk lattice. Therefore one could
simplistically expect a TC reduced roughly by a factor of two compared to that of
the bulk, if the interaction with the substrate was neglected. Such a reduction
is indeed observed at the (111) surface of a C60 crystal [143, 156]. In
contrast, our experiment shows the same value of TC = 259K for the C60
monolayer as that of the bulk, suggesting that an energy contribution
on the order of kBTC = 24meV originates from interactions with the
substrate.
There are two possible mechanisms for such an interaction: via the crystal
field, which has a strong component perpendicular to the substrate due to the
breaking of z-translational invariance [157]; or due to the effect of the overlap of
the orbitals of the C60 molecules and the substrate.
The wave function of the HOMO of a single C60 decays out of the molecule
over the length scale of a covalent bond (1.4 Å). This is comparable to
the distance between the C atoms of an individual C60 molecule and the
substrate surface atoms, as determined experimentally (approximately
1.5 Å). The importance of the interaction of C60 with the substrate is
confirmed by the decoration of WO2/W(110) grooves by spinning molecules
(Figure 3.15d). This suggests that the energy of the C60 is sensitive even to
relatively small changes in the environment, such as being brought into
closer contact with the substrate due to the WO2/W(110) coincidence
structure.
In the mean field theory approximation, the order parameter’s dependence on
the temperature is specified as p2 ≈ = α(TC − T), where α = 0.012K-1.
The experimentally-measured value of α = 0.022 ± 0.002K-1 is approximately a
factor of two greater than that predicted by theory. One reason for this
discrepancy is that correlation effects are ignored by mean field theory. Examples
of such correlation effects that have been observed are presented in Figure 3.12d,
where it is shown that static molecules form clusters, and their orientations within
the clusters are correlated. This implies that the total energy of a molecule’s
interaction with its neighbours is also affected by its configuration on the
substrate.
= α(TC − T), where α = 0.012K-1.
The experimentally-measured value of α = 0.022 ± 0.002K-1 is approximately a
factor of two greater than that predicted by theory. One reason for this
discrepancy is that correlation effects are ignored by mean field theory. Examples
of such correlation effects that have been observed are presented in Figure 3.12d,
where it is shown that static molecules form clusters, and their orientations within
the clusters are correlated. This implies that the total energy of a molecule’s
interaction with its neighbours is also affected by its configuration on the
substrate.
3.5.5 Kinetic transition
The glassy transition and non-exponential relaxation in solid C60 are due to the
freezing of weakly-correlated orientations of nearest-neighbor molecules [137]. In
bulk C60, the molecules can occupy two rotational orientations which are almost
equivalent in energy but are separated by a potential barrier, and these
orientations are distributed in a random fashion over the sites of an FCC
lattice. The relaxation of solid C60 is determined by the potential barrier
between these two states. All individual molecules in solid C60 occupy
equivalent positions in the FCC lattice; each molecule relaxes nearly identically
in an intrinsically non-exponential manner according to a homogeneous
scenario [158].
This relaxation is characterized by the Kohlrausch-Williams-Watts or
stretched exponential function, q(t) = q0 exp[−(t∕τ)β], where τ is the relaxation
time, and β is called the non-exponential factor or “stretching exponent”. β = 1
corresponds to an exponential, Arrhenius-like relaxation [137]. The temperature
dependence of τ can be fitted by the Vogel-Fulcher-Tammann (VFT) function,
τ(T) =  exp[
exp[ ], where fl is the libron frequency [158, 159]. When
T0 = 0K, the Arrhenius equation is realized and W corresponds to the activation
energy. According to empirical observations, T0 corresponds to the temperature of
an ideal glass state (“Kauzmann temperature”), at which the crystal and the
extrapolated glass state attain equal entropies [159] and the relaxation time
becomes infinite.
], where fl is the libron frequency [158, 159]. When
T0 = 0K, the Arrhenius equation is realized and W corresponds to the activation
energy. According to empirical observations, T0 corresponds to the temperature of
an ideal glass state (“Kauzmann temperature”), at which the crystal and the
extrapolated glass state attain equal entropies [159] and the relaxation time
becomes infinite.
Both β and  are a measure of the deviation from Arrhenius relaxation. The
relaxation in solid C60 was found to differ slightly from a purely exponential decay
(β = 0.94) [137]. The kinetic behavior of the C60 monolayer grown on the
WO2/W(110) surface is influenced by several factors. The low-temperature glassy
state of the C60 film is characterized by a random orientation of the molecules
(Figure 3.12a). In contrast, the glassy state in solid C60 is characterized by the
random freezing of molecules among just two states. The large number of different
molecular orientations observed in the film results in an averaging-out of the
interaction potentials and should cause Arrhenius-like relaxation processes.
However, STM experiments reveal correlations in the nanomotion of the C60
molecules that suggest arguments in favour of a constrain-dynamic scenario [160].
It is proposed that the mechanism for the molecule–molecule interaction
required for such a constrain-dynamic scenario can be based on some
molecules acquiring charge. Indeed, the time-resolved STM experiments
presented herein demonstrate that the rotational transition of an individual
C60 molecule between states is accompanied by charge transfer to the
molecule, and subsequently, charge carried by a molecule affects the energy
levels and barrier heights of its neighboring molecules via the Coulomb
interaction.
are a measure of the deviation from Arrhenius relaxation. The
relaxation in solid C60 was found to differ slightly from a purely exponential decay
(β = 0.94) [137]. The kinetic behavior of the C60 monolayer grown on the
WO2/W(110) surface is influenced by several factors. The low-temperature glassy
state of the C60 film is characterized by a random orientation of the molecules
(Figure 3.12a). In contrast, the glassy state in solid C60 is characterized by the
random freezing of molecules among just two states. The large number of different
molecular orientations observed in the film results in an averaging-out of the
interaction potentials and should cause Arrhenius-like relaxation processes.
However, STM experiments reveal correlations in the nanomotion of the C60
molecules that suggest arguments in favour of a constrain-dynamic scenario [160].
It is proposed that the mechanism for the molecule–molecule interaction
required for such a constrain-dynamic scenario can be based on some
molecules acquiring charge. Indeed, the time-resolved STM experiments
presented herein demonstrate that the rotational transition of an individual
C60 molecule between states is accompanied by charge transfer to the
molecule, and subsequently, charge carried by a molecule affects the energy
levels and barrier heights of its neighboring molecules via the Coulomb
interaction.
From the lifetime of a molecule in a single state, the potential barrier height
separating the states has been calculated to be 617 meV. If one assumes that the
bulk libron frequency of fl = 1 × 10¹²Hz and the relaxation time at the
temperature of glassy transition for solid C60, τS(90K) = 1day can be applied
to the film, then the VFT law can be used to estimate the Kauzmann
temperature T0. The obtained value T0 = 45K indicates that the relaxation
process in the C60 monolayer film is close to the Arrhenius scenario of
 = 0.2.