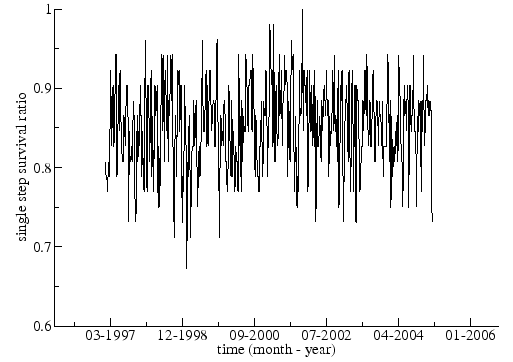
Figure 3.12 presents the single-step survival ratios for the MST of country indices. The average is about ![]() , indicating that a large majority of links between markets survives from one window to the next. As might be expected, the ratio increases with increases in window length. Figure 3.13 shows the multi-step survival ratio. In both cases we used
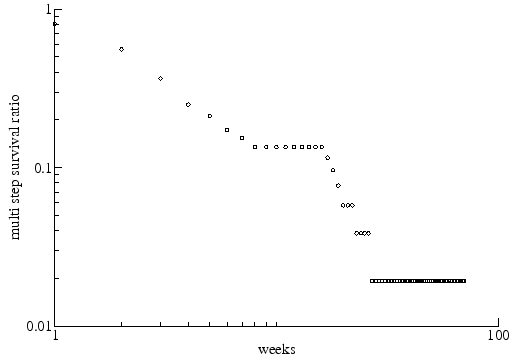
, indicating that a large majority of links between markets survives from one window to the next. As might be expected, the ratio increases with increases in window length. Figure 3.13 shows the multi-step survival ratio. In both cases we used ![]() weeks and
weeks and ![]() week. Here, as might be expected, the connections disappear quite rapidly, but a small proportion of links remains intact, creating a stable base for construction of the MST. Again the evidence here is of importance for the construction of portfolios, indicating that while most linkages disappear in the relatively short to medium term there are islands of stability where the dynamics are consistent. The behavior of these two measures is similar to what has been observed for individual stocks within a single equity market [20]. These results may understate the stability of the global system of markets since some of the linkage shifts appear to take place within relatively coherent geographical groups.
week. Here, as might be expected, the connections disappear quite rapidly, but a small proportion of links remains intact, creating a stable base for construction of the MST. Again the evidence here is of importance for the construction of portfolios, indicating that while most linkages disappear in the relatively short to medium term there are islands of stability where the dynamics are consistent. The behavior of these two measures is similar to what has been observed for individual stocks within a single equity market [20]. These results may understate the stability of the global system of markets since some of the linkage shifts appear to take place within relatively coherent geographical groups.
 |
 |