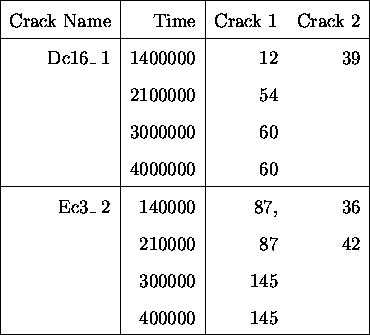
Table ![]() shows a sample of the raw data as recorded by the engineers. The
`,' indicates that cracks did not coalesce by the next observation, whereas the lack
of a `,' indicates that they did. In order to fit a model using data from each time,
the data must consist of a sequence of observations, one for each observation time for
each independent crack.
shows a sample of the raw data as recorded by the engineers. The
`,' indicates that cracks did not coalesce by the next observation, whereas the lack
of a `,' indicates that they did. In order to fit a model using data from each time,
the data must consist of a sequence of observations, one for each observation time for
each independent crack.

Table: Raw Data as for Cases where 2 Cracks
Coalesce; Part of 140kN Data.
In other words, it is not possible to analyse data that consists of values for crack j and crack k at timepoint m and then, following coalescence of j and k, a single data point at m+1. There are a number of possible options for dealing with this data:
An initial examination of the data suggested that coalescence was not all that common a phenomenon, and where it did occur, it often occurred quite early on in the specimen lifetime.
While it would be preferable to model coalescence, it initially appeared that the extra complexity would not be worthwhile. However, since failure is caused by the largest crack, which itself may have been involved in coalescence, it is important that real data is not just ignored. This meant that the only option left was to transform the data set.
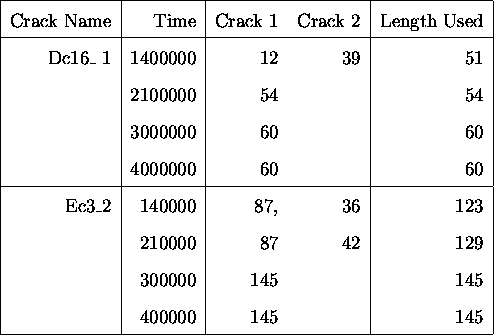
It was decided to use the simplest of adaptations, that is, each
crack extant at the final timepoint would be numbered from 1 to
J. Then if a particular crack had been involved in coalescence
at the length used at time n for crack j would be just the sum
of the lengths of the coalescing cracks. This is consistent with
the approach adopted by authors in the engineering field. An
example of this is shown in table ![]() , based upon the
data in table
, based upon the
data in table ![]() .
.

Table: Data as Interpreted for
Growth Model.
Implicit in this adaptation of the data is that the rate of growth
of two coalescing cracks is the same as that of a single crack
with length the sum of the lengths of the two cracks. That is,
given two cracks, ![]() and
and ![]() , that subsequently coalesce to
form
, that subsequently coalesce to
form ![]() , with lengths given by
, with lengths given by
![]()
Then the assumption that the transformed data represents what truly occurs is the same as the assumption that
![]()
or equivalently
![]()
which, given ![]() implies
implies
![]()
which is clearly not the case unless ![]() ,
which does not hold for this model.
,
which does not hold for this model.
However, even though this assumption is technically incorrect, it was made initially, in the hope that it will not be of substantial importance with regard to the overall reliability prediction.
An extra complicating factor was that the coalescence did not necessarily result in a crack which had length the sum of the constituent cracks. The reason for this was that the length that was measured for any particular crack was determined by a straight line distance. Thus, if two cracks were not parallel, the resultant crack would be shorter than the sum of the constituent parts. This is most apparent in the 200kN data, where many early cracks appear to shrink quite dramatically.