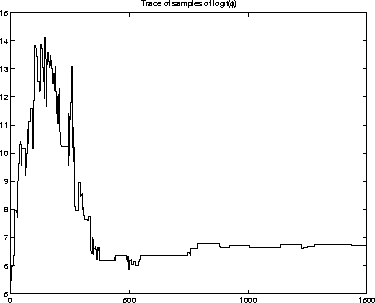
Figure: A Typical Trace of Samples for
The results consist of samples from the posterior distribution, together with kernel density estimates for the reliability R(N).

Figure: A Typical Trace of Samples for ![]() .
.
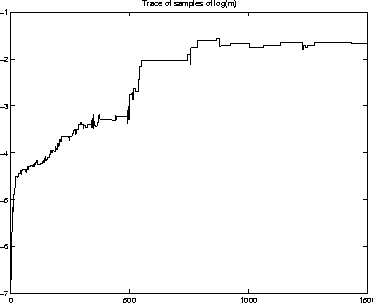
Figure: A Typical Trace of Samples for m.
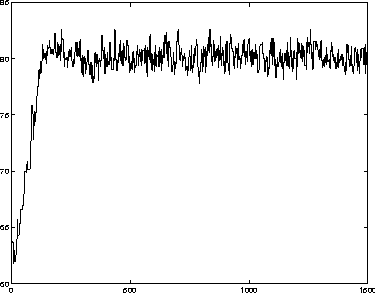
Figure: A Typical Trace of Samples for D.
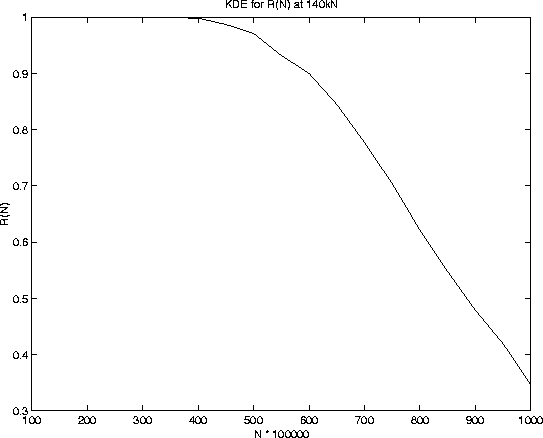
Figure: Kernel Density Estimate for R(N) at 140kN. ![]()
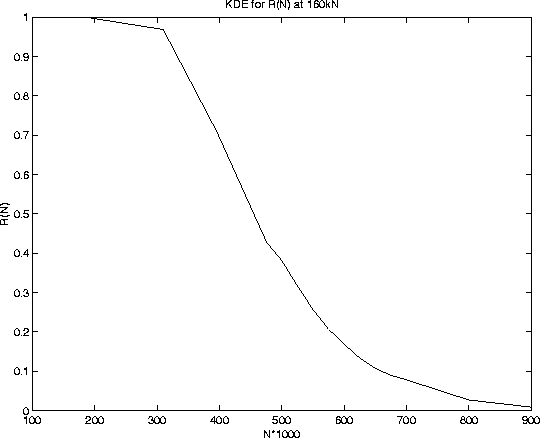
Figure: Kernel Density Estimate for R(N) at 160kN. ![]()
Figures ![]() ,
, ![]() ,
, ![]() show typical
traces for the MCMC samples from the posterior distributions of
show typical
traces for the MCMC samples from the posterior distributions of
![]() , m, and D. These traces are from a single run of the
chain for single cracks. It was necessary to draw samples from the
posterior distribution for each of the crack specific parameters,
that is for each crack in the specimen in order to calculate the
kernel density estimates which are provided in
Figures
, m, and D. These traces are from a single run of the
chain for single cracks. It was necessary to draw samples from the
posterior distribution for each of the crack specific parameters,
that is for each crack in the specimen in order to calculate the
kernel density estimates which are provided in
Figures ![]() and
and ![]() . These kernel density
estimates are approximations to the posterior distribution for
R(N) for each of the sets of data, that is
. These kernel density
estimates are approximations to the posterior distribution for
R(N) for each of the sets of data, that is ![]() , as
outlined in Section
, as
outlined in Section ![]() .
.