The posterior distribution for the rate, ![]() is plotted in
Figure
is plotted in
Figure ![]() . The trace for
. The trace for ![]() and a histogram of
samples for
and a histogram of
samples for ![]() are given in Figure
are given in Figure ![]() and
Figure
and
Figure ![]() . The value of the sum of lengths of cracks
before coalescence is 1014, which is far larger than any of the
samples from the posterior. The trace for
. The value of the sum of lengths of cracks
before coalescence is 1014, which is far larger than any of the
samples from the posterior. The trace for ![]() is consistent with
a uniform[35,40].
is consistent with
a uniform[35,40].
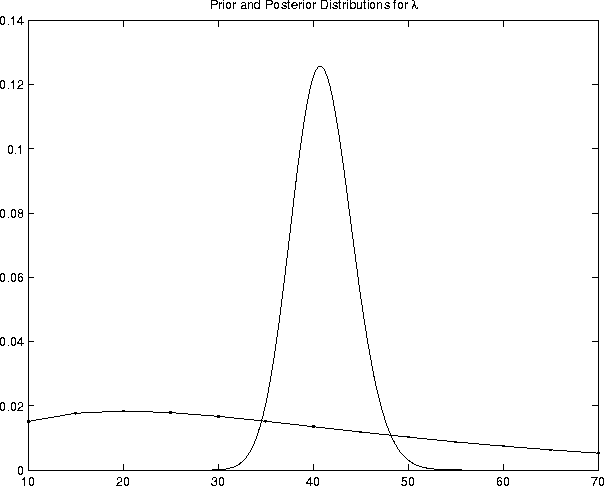
Figure: Prior (dotted) and Posterior Distributions for Rate, ![]() .
.
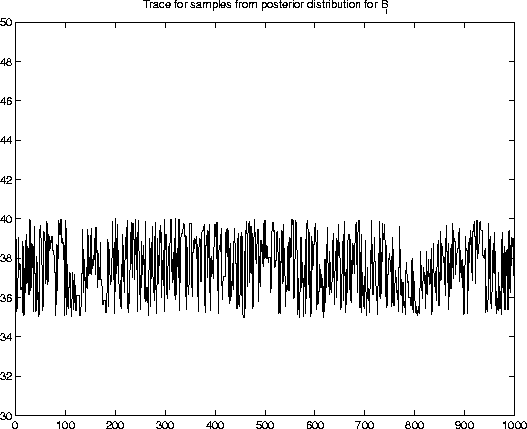
Figure: Samples from the Posterior Distribution of ![]() for a Single Crack.
for a Single Crack.
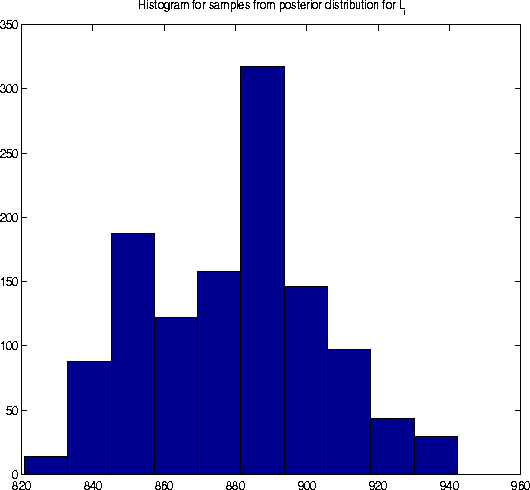
Figure: Histogram of Samples
from Posterior of ![]() for Crack d1ea.
for Crack d1ea.