5.4 Axial ligand transformation
X-ray absorption spectroscopy (XAS) performed on the as-deposited MnClTPP
exhibits the characteristic shape of the Mn(III) oxidation state, as shown in
Figure 5.7 (bottom spectrum).
The Mn 2p3∕2 (L3) XAS edge consists of three features, labelled A, B and C in
Figure 5.7. These correspond to a convolution of the interactions between the
core 2p electrons with the outer valence electrons, and have been shown to reflect
the oxidation state of the Mn ion [225, 226]. However, the decomposition of such
spectra is complex, involving up to 7 individual peaks [227], and so the main
features will be treated as a “fingerprint” of the oxidation state here. When the
Mn ion is in the (III) oxidation state, the B feature dominates, with a significant
contribution from A and a lower shoulder at C, as shown in the initial and final
spectra in Figure 5.7. In the Mn(IV) state, the contribution of the C feature
dominates.
When the Mn(III)ClTPP ML is annealed at 510 K, the Cl ligand is removed
but from the shape of the XAS (red curve) it is clear the oxidation state of the
Mn ion is unchanged. Without the Cl ligand, the Mn(III) ion would be
undercoordinated by only the porphryin macrocycle alone. It is suggested that the
Mn is coordinated by the Ag(111) surface, which acts as a fifth ligand for the Mn
ion, stabilising the (III) oxidation state. A similar hypothesis has been put
forward for previous studies of axial ligand transformation [195, 211, 228],
with an atom of the noble metal surface ligating to the transition metal
core.
Upon subsequent exposure of the Mn(III)TPP/Ag(111) complex to O2, the
Mn 2p lineshape changes significantly. As oxidation time increases, the relative
contributions of the A and B features diminish, and the C peak grows to be the
principal feature. This implies that exposure to oxygen causes the Mn ion to
change from the III oxidation state to the IV. Also noted are clear changes in the
Mn 2p1∕2 peak, which are harder to quantify, but nevertheless support the
oxidation of the Mn core.
It is postulated that the oxygen molecule binds to the Mn(IV) ion intact as
the peroxide anion, O22−, with the two O atoms sharing a single bond and the
anion bound to the Mn centre, and this will be shown in detail in the following
sections. The Mn oxidation is reversible however, and further annealing
at 445 K removes the bidentate peroxide ligand, restoring the Mn(III)
lineshape.
5.4.1 Removing the Cl-ligand
STM performed after the initial anneal step to remove the Cl-ligand is presented
in Figure 5.8. The occupied-state appearance of MnTPP (Figure 5.8a) appears
almost identical to that of MnClTPP prior to annealing.
The four phenyl rings are still visible and the centre of the macrocycle appears
dark, as in Figure 5.6a, and the monolayer exhibits unchanged square lattice
parameters of 1.41 ± 0.05 nm. The rectangular arrangement of the phenyl rings is
also unchanged, implying that the removal of the axial ligand does not greatly
affect the aryl-group substituents. However, when the unoccupied states are
probed at a positive sample bias (Figure 5.8b), the molecules’ appearance is
strikingly different.
The central protrusion previously seen is gone, giving further evidence for the
removal of the Cl-ligand. Instead, the molecules appear as four large protrusions,
corresponding to the positions of the phenyl substituents. The “buckling”
described in a previous section is still visible in both the occupied and unoccupied
state images, suggesting that it is topological in nature (i.e. a rotation of
one phenyl ring out of the surface), however in the latter case it is less
pronounced.
In order to examine the behaviour of the MnTPP molecules after the Cl-ligand
is removed, Mn(III)TPP on Ag(111) was simulated using DFT, and the
relaxed model is shown in Figure 5.9, along with the relaxed model of
Mn(III)ClTPP. In the simulation, four layers of Ag were used, with the lower two
constrained to simulate the bulk. The molecules were placed on top of the
Ag(111) surface and allowed to relax along with the top two layers of Ag. A
vacuum slab of 10 Å was used to separate the system from its translational
images.
As can be seen from the side-views in Figure 5.9a and b, the removal of the
Cl-ligand has little effect on the porphyrin macrocycle and its phenyl substituents,
consistent with STM images.
The Mn centre in Mn(III)TPP, however, is situated 3.4 pm closer to the
Ag(111) surface, and in turn the Ag atom directly below the Mn ion is pulled out
of the surface towards the molecule by 8.7 pm. This supports the theory that the
Ag(111) surface is indeed acting as a fifth ligand and stabilising the (III)
oxidation state of the Mn ion centre.
In order to measure the activation energy required to trigger the desorption of
the Cl-ligand, XPS was performed on the MnClTPP monolayer while it was
annealed. The spectra obtained are presented in Figure 5.10a.
The spectra were measured while the temperature was increasing, with
the temperature shown on the right of the plots. It is observed that at
around 510 K, the Cl 2p peaks are reduced to the level of the background
noise.
The Arrhenius rate equation (Equation 5.1) relates the rate of a reaction,
k with its activation energy, ΔE and the temperature of the reaction,
T.
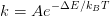 | (5.1) |
where kB is the Boltzmann constant and A is the prefactor.
The two Cl 2p peaks were each fitted by a Gaussian, and the area of
that fit peak was was used to calculate the rate of Cl removal, taking
into account the deviation of the spectrum from the fit to calculate the
uncertainties. Since the experiment was performed with a constant heating rate of
0.15 K/sec, the difference in area between two spectra can be used to
derive the rate of the desorption. ln(k) vs. 1∕T is plotted in Figure 5.10b,
and the slope of the fit line gives a value for the activation energy of
ΔECl = 0.35 ± 0.02eV.
5.4.2 Reaction with O2
After removing the Cl ligand from the MnClTPP molecules, they were exposed to
oxygen gas for various lengths of time in order to study the effect of oxidation on
the molecular layer.
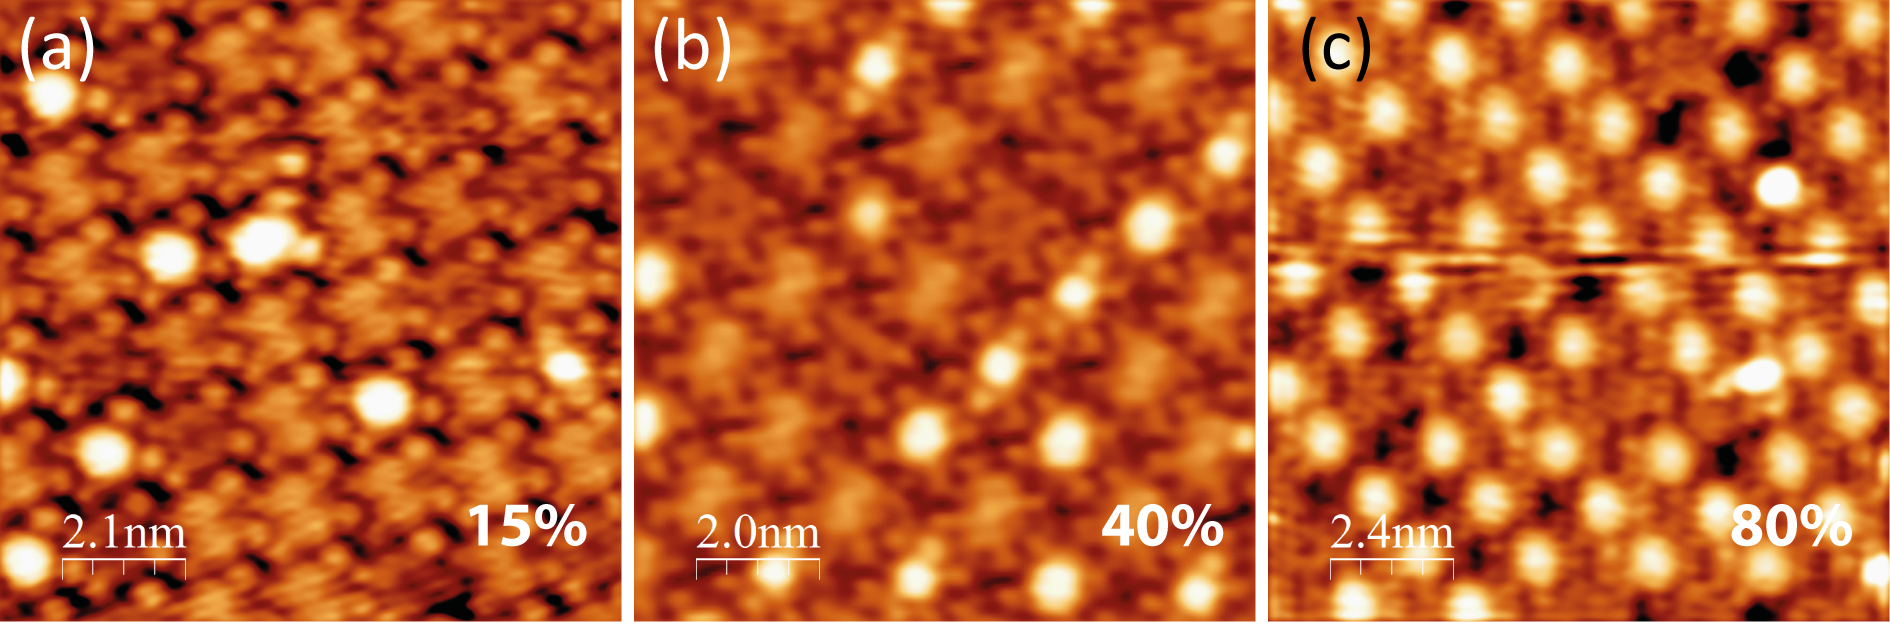
STM images recorded after 15, 30 and 90 minutes’ oxygen exposure at a
partial pressure of 2 × 10⁻⁶ mbar are shown in Figure 5.11. It is observed that
some molecules exhibit a very bright centre, and the number of these molecules
increases with oxygen exposure, so it is reasonable to assume that this appearance
corresponds to the Mn(IV)O2TPP complex. The lattice parameters of the ML are
unchanged from those of MnClTPP and MnTPP, consistent with observations
that the meso-aryl substituents are the main factors in supramolecular
ordering [194].
The percentages shown on each image indicate the amount of Mn(III)TPP
molecules that have been converted to the Mn(IV)O2TPP state. The coverages
correspond approximately to the XAS spectra shown in Figure 5.7, with the
green spectrum showing ∼15% of the molecules oxidised, dark blue ∼40%, and
light blue ∼80%.
After exposures of 90 minutes or more, approximately 80% of the molecules are
converted to Mn(IV)O2TPP, however at this point the extent of oxidation appears
to saturate. The ∼20% unoxidised molecules are attributed to those molecules
that lie on top of defects on the surface, or the very few that still have the
Cl-ligand attached.
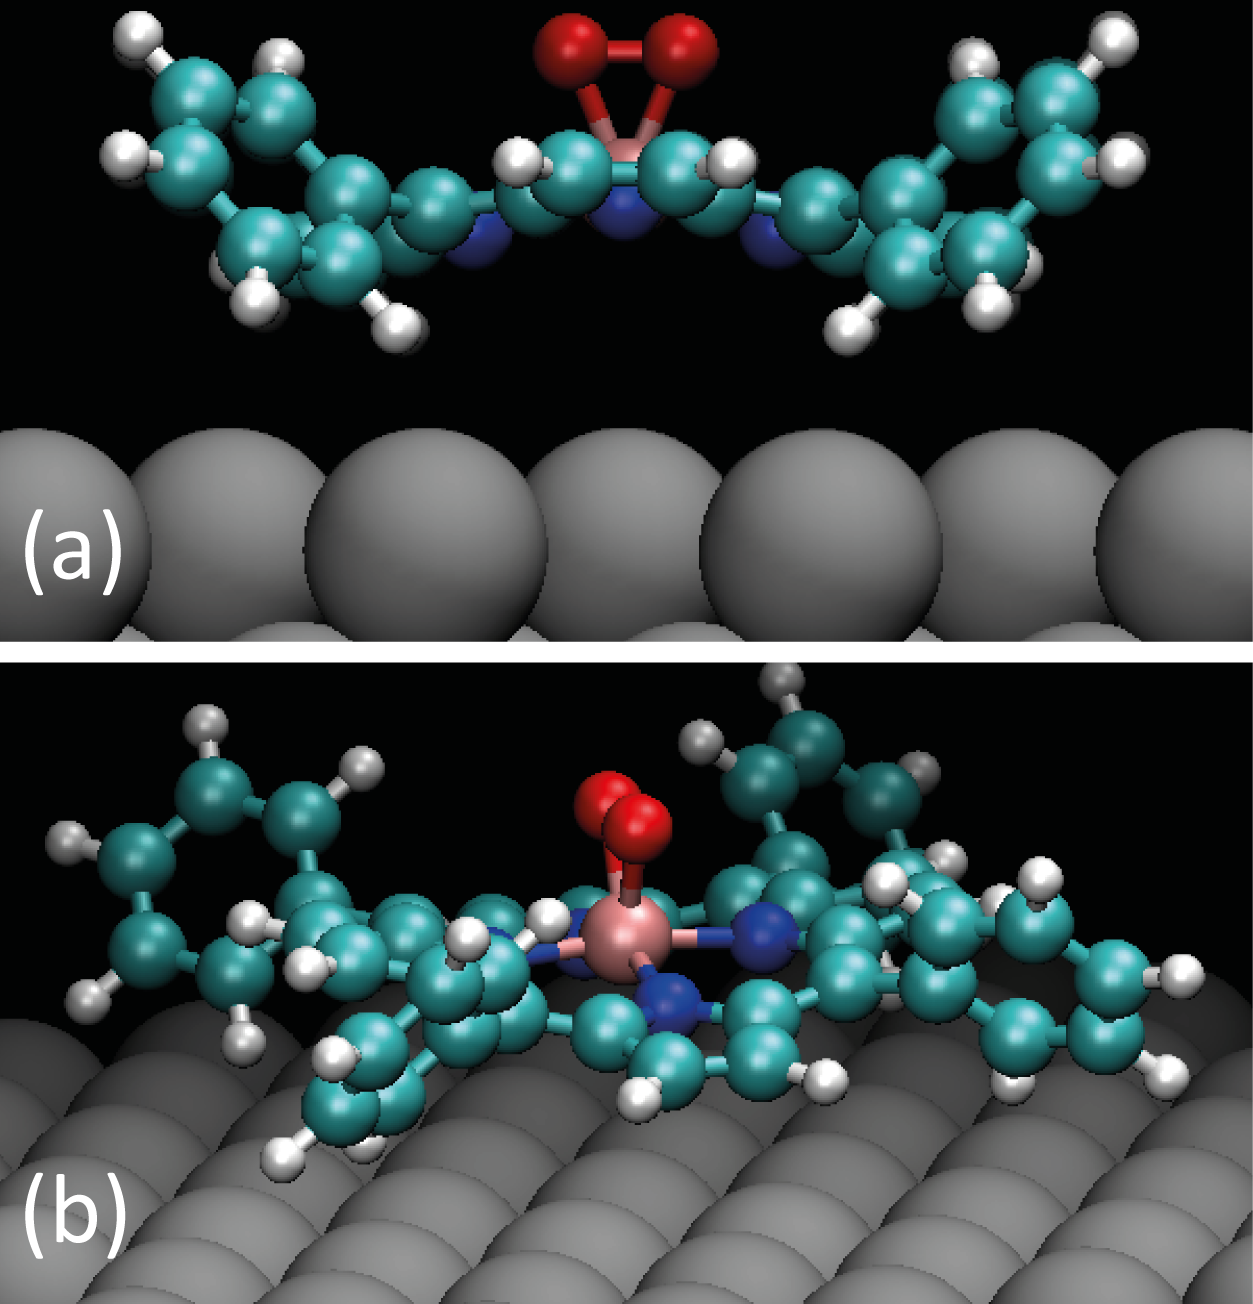
The MnO2TPP molecule was also simulated using DFT. Identical constraints
were applied as in the previous section. The relaxed structure is shown in
Figure 5.12.
Figure 5.12a shows the side view of the molecule, showing the saddling of the
molecule, similar to that of MnClTPP and MnTPP, although the view is rotated
by 90° to Figure 5.10 in order to show the orientation of the O–O bond.
Initially before relaxation, the bidentate peroxide ligand was positioned
“diagonally” across the molecule, with the bond pointing along the line
between two phenyl rings. It was first assumed that the O–O ligand would
be repelled by the N atoms of the pyrrole rings, however when it was
allowed to relax, the O–O bond rotated to lie along the convex slope of the
saddle. Several starting positions were attempted, however the O–O bond
consistently aligned itself parallel to the Mn–N bonds of the porphyrin, although
the alignment along the convex slope (not shown) gave a higher total
energy, and so it is assumed that the arrangement shown is the optimal
structure.
It is unclear whether this relaxation is due to the O22− anion avoiding the
phenyl rings’ steric hindrance [229], or due to an interaction between its electron
lone-pairs and the π-electron system of the macrocycle, however hydrogen
bonding between the anion and the phenyl rings can be ruled out, due to the
former’s preference to orient away from the latter, and the unaltered position of
the phenyl rings after relaxation.
It was found that annealing the MnO2TPP monolayer up to 445 K
caused the desorption of the peroxide bound to the molecules without
disturbing the structure of the monolayer, and STM images of Mn(III)TPP
identical to those presented in the previous section were obtained (not
shown).
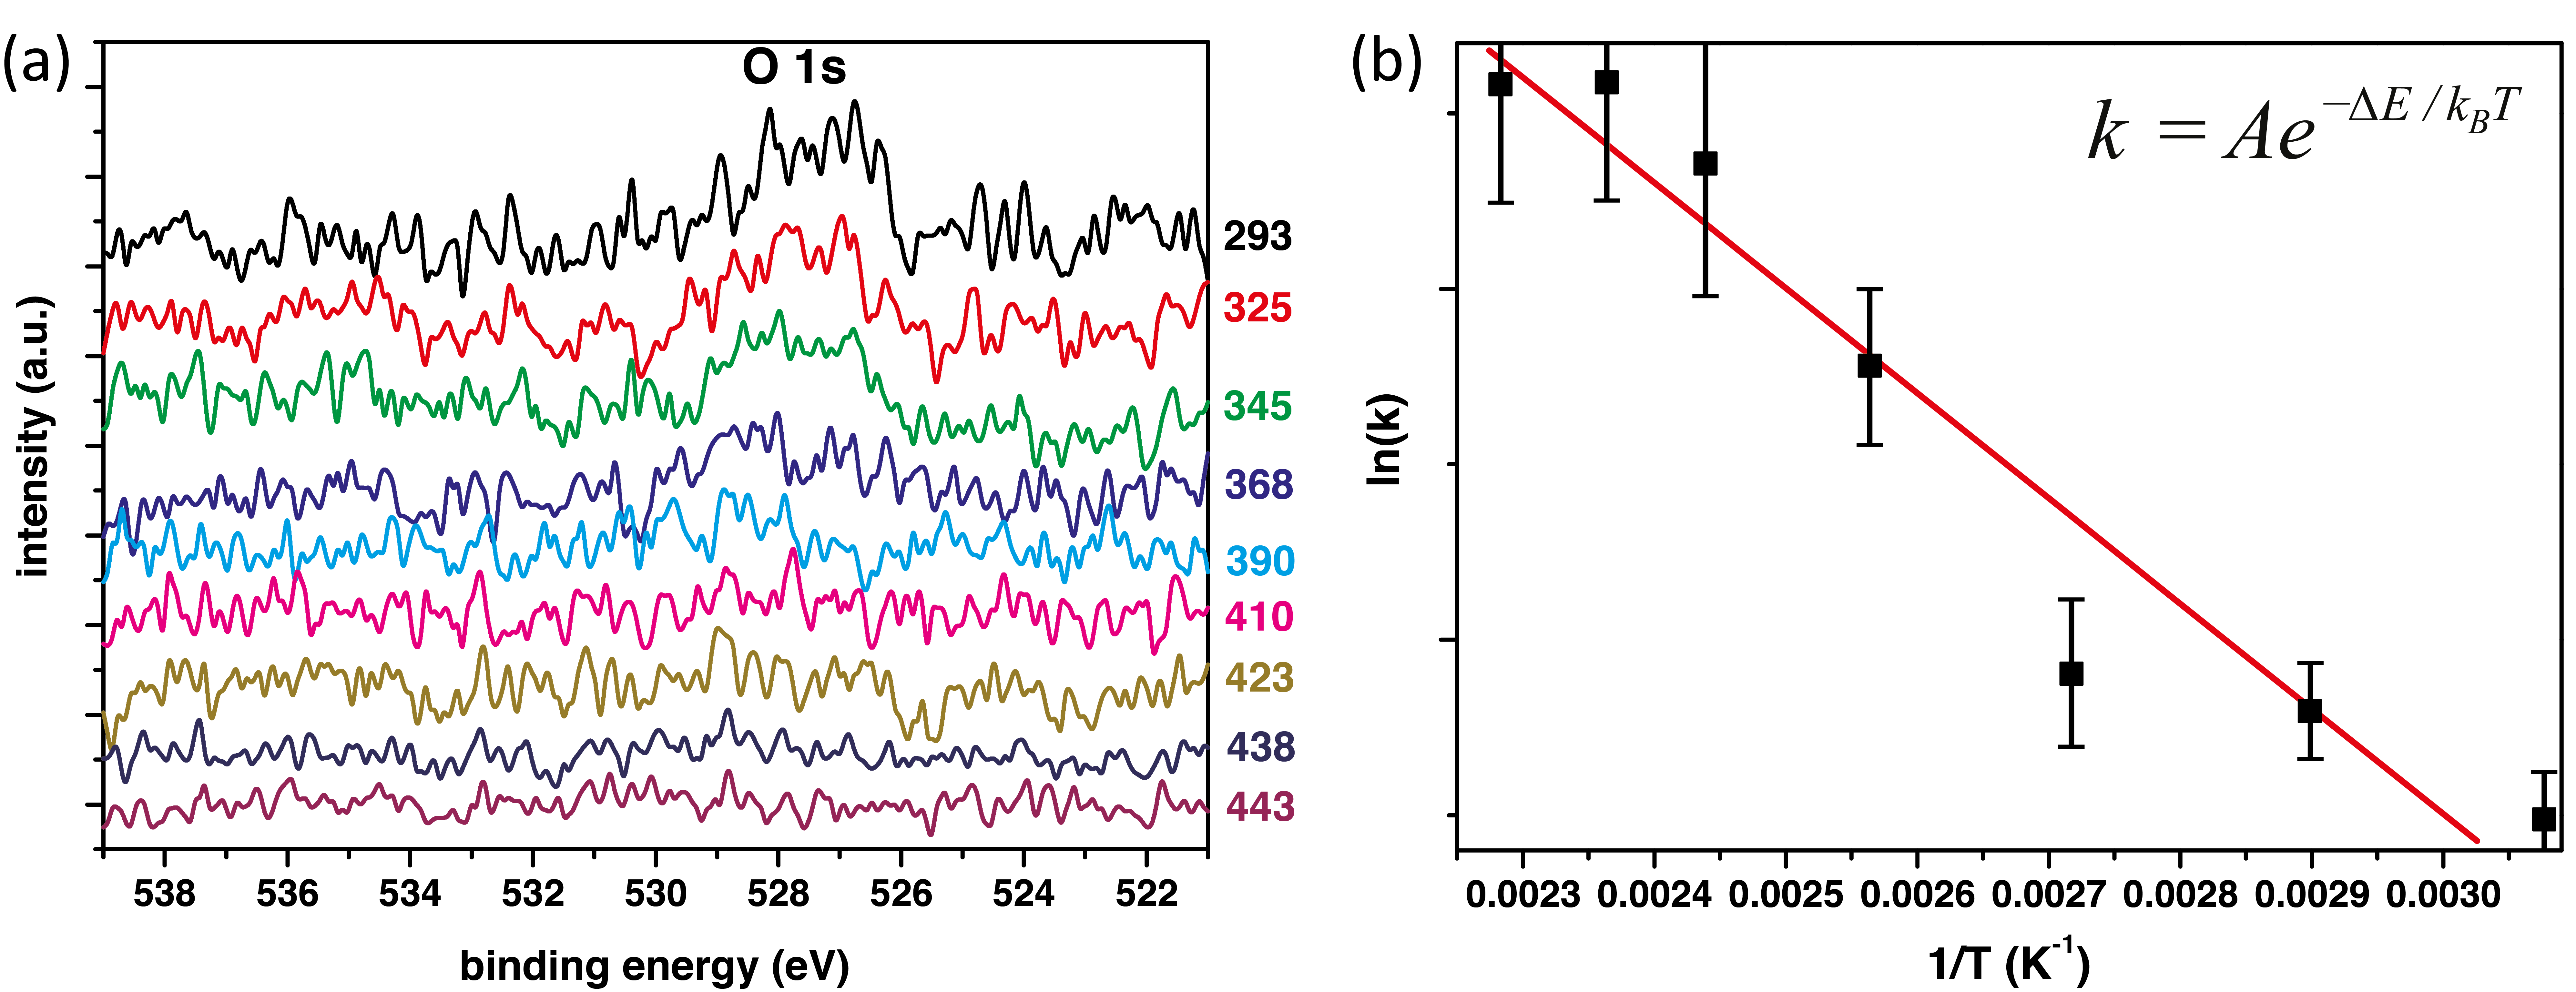
In order to measure the activation energy for the desorption of O2 from the
molecules, XPS was performed while the monolayer was annealed, similar to the
case of the Cl-ligand desorption. The O 1s spectra are presented in Figure 5.13a,
with the temperature at which each spectrum was recorded shown at the
right side. The same heating rate as for Cl-desorption of 0.15 K/sec was
used.
The XPS data was treated similarly to the previous section describing the
Cl desorption, and Figure 5.13b shows the Arrhenius plot for oxygen
desorption.
In this case, the activation energy for the desorption of O2 was found to be
ΔEO2 = 0.26 ± 0.03eV. This value is lower than that for Cl desorption, indicating
a weaker binding for the peroxide ligand than for the Cl ligand.
Interestingly it was noted that it was not possible to directly substitute O2 for
Cl at room temperature by exposing the MnClTPP monolayer to O2 gas. This
follows intuitively from the fact that the Cl ligand is more strongly bound to the
Mn ion than the peroxide ligand, and so it is not energetically favourable for O2
to displace the Cl ligand.