The kernel density estimates for the marginal distribution of the various parameters may be of interest, but as far as model checking is concerned, the procedure adopted was to censor the final datapoint and make predictions based on the rest of the data.
That is;
And so we use the posterior predictive distribution in order to estimate the value of
![]() . Quite favourable results are achieved, as outlined in the
Figure
. Quite favourable results are achieved, as outlined in the
Figure ![]() .
.
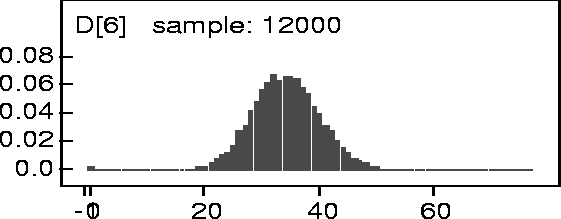
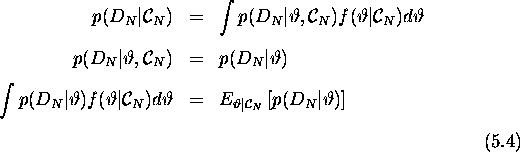
Figure: KDE
of D[6] for 200kN Data.
The figure shows the posterior kernel density estimate for ![]() conditional on
conditional on ![]() . The actual observed value for
. The actual observed value for ![]() was 35. The mean of the kernel
density was 33.4 and the median was 34. This analysis was for the 200kN data. Similar
results were obtained for the 140kN and 160kN sets and are included in
Figure
was 35. The mean of the kernel
density was 33.4 and the median was 34. This analysis was for the 200kN data. Similar
results were obtained for the 140kN and 160kN sets and are included in
Figure ![]() and Figure
and Figure ![]() .
.
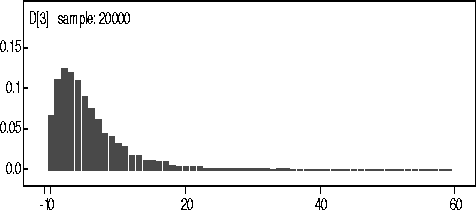
Figure: KDE
of D for 140kN data.
The actual observed number of coalescences for the 140kN Data was 7. The mean and median from the kernel density estimate were 5.4 and 4 respectively.
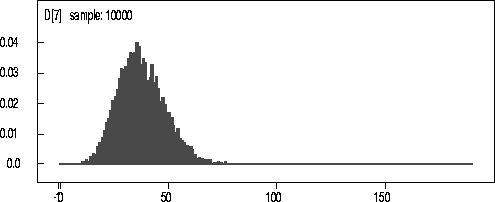
Figure: KDE
of D for 160kN data.
The actual observed number of coalescences for the 160kN Data was 28. The mean and median from the kernel density estimate are 33.2 and 34 respectively. In all these cases the observed value falls comfortably within the 25th and 75th percentiles of the kernel density estimate.
For completeness, the trace for ![]() for the 140kN chain is included in
Figure
for the 140kN chain is included in
Figure ![]() . The chains were similar for the other parameters of interest.
. The chains were similar for the other parameters of interest.
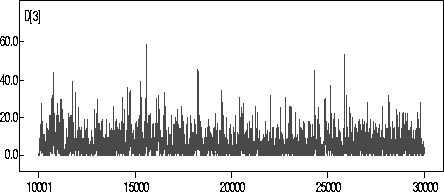
Figure: Chain for ![]() for 140kN Data.
for 140kN Data.
Thus, a straightforward model is employed in the modelling of rate, and it appears to fit the data which we have. Concern should be expressed about a number of the details; this is done in what follows. However, even this simple model allows a very important insight.