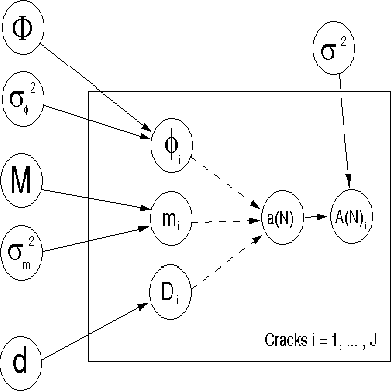
The relationship between the random variables and observables for
the model may be represented by a directed graph as outlined in
Section ![]() . This is done for this model in
Figure
. This is done for this model in
Figure ![]() .
.

Figure: Directed Acyclic Graph for Growth Model.
Shown in the directed acyclic graph are the relationships between
the various parameters of interest. The crack specific parameters
yield, through integration of the differential equation, a
deterministic link to the mean crack length ![]() . The observed
data is assumed to be normally distributed around the mean. This
is shown as a probabilistic link directed from
. The observed
data is assumed to be normally distributed around the mean. This
is shown as a probabilistic link directed from ![]() to
to ![]() . The
variance is common to all cracks, and is outside the plate of
variables.
. The
variance is common to all cracks, and is outside the plate of
variables.
The model proposes that ![]() come from a normal with mean
M and variance
come from a normal with mean
M and variance ![]() , and
, and ![]() come
from a normal with mean
come
from a normal with mean ![]() and variance
and variance ![]() . It is
assumed that the
. It is
assumed that the ![]() are exchangeable, which is
consistent with a hierarchical population model. This is
represented in the directed graph by hyperparameters
are exchangeable, which is
consistent with a hierarchical population model. This is
represented in the directed graph by hyperparameters ![]() .
.
The distribution assumed for the hyperparameters is somewhat
arbitrary and comes about from consideration of the allowable
values for ![]() and
and ![]() . Specifically, the
. Specifically, the
![]() transforms [0,1] to
transforms [0,1] to ![]() ,
and
,
and ![]() ensures
ensures ![]() positive.
positive.
Recall that the aim is to estimate the reliability for the
specimen, R(N). Since this is defined as the probability that
none of the cracks has reached the threshold length, ![]() , it
may be written;
, it
may be written;
It is demonstrated later that the exchangeability within the model simplifies the evaluation of R(N) greatly.