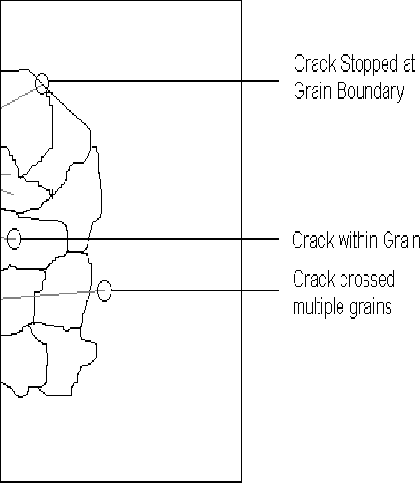
Figure: Illustration of Different Phases of Crack
Growth through the Material Microstructure.
Figure ![]() shows qualitatively the different stages in
crack propagation. Within the granular structure of the material,
cracks grow reasonably quickly, until they are slowed due to the
obstacle of the grain boundary, after which time their rate of
growth speeds up once again. To have a clear understanding about
what is being analysed, it is useful to clarify what a microcrack
is.
shows qualitatively the different stages in
crack propagation. Within the granular structure of the material,
cracks grow reasonably quickly, until they are slowed due to the
obstacle of the grain boundary, after which time their rate of
growth speeds up once again. To have a clear understanding about
what is being analysed, it is useful to clarify what a microcrack
is.
The above definition, which comes from the introductory remarks in the work of Miller and de los Rios [32], is necessarily vague. Indeed, there are a number of ways of specifying what constitutes short fatigue crack growth in the literature ranging from the at first seemingly unhelpful [47],
Short crack propagation (SCP) : fatigue crack growth which cannot be described by linear elastic fracture mechanics.to the more useful detailing of typical lengths in terms of grain diameters ( < 5 - 15 diameters) for different materials as in Blom [6]. Of course, this analysis is based on the behaviour of cracks within the materials in question, and whether they follow the usual rules for growth. Further, more recent classifications of different types of short crack growth are given in Brown [8] and Zhao et. al. [60].
However, it should be remembered that the primary reason for interest in these cracks is that the models which have been developed for (long) crack propagation do not work. As such, the definition by Smith et al. [47], is in fact more accurate than it first seems.
Brown [8], as well as many other authors cite the original work of Kitagawa-Takahashi [24] who produced a diagram which relates stress level, initial crack length, and type of growth. The theory suggests that cracks below a certain length have a higher fatigue limit, and do not follow linear elastic fracture mechanics. Developments from the Kitagawa-Takahashi diagram have led to new theories for the classification of short, transitional and long crack growth.
Figure ![]() shows a plot of rates of growth for short cracks. This is a
plot of the average of
shows a plot of rates of growth for short cracks. This is a
plot of the average of ![]() versus a(N) for a set of cracks
present in a specimen subjected to cyclic stressing at 140kN. The slowing of the rate
of growth is consistent with previous experience, and is the well known grain effect.
In this data, the effect of the grain boundary on growth can clearly be seen, by three
distinct minima in growth rate.
versus a(N) for a set of cracks
present in a specimen subjected to cyclic stressing at 140kN. The slowing of the rate
of growth is consistent with previous experience, and is the well known grain effect.
In this data, the effect of the grain boundary on growth can clearly be seen, by three
distinct minima in growth rate.
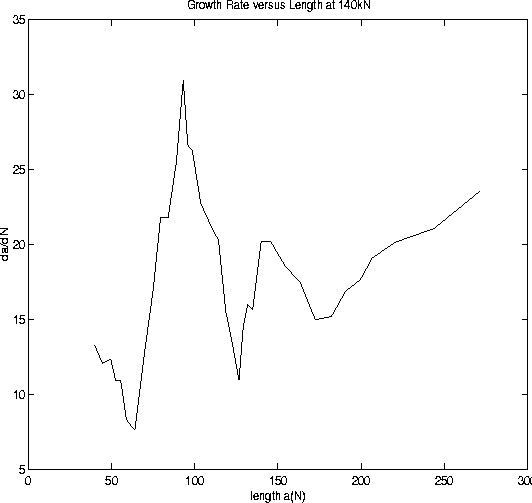
Figure: Plot of Rates
of Growth for 140kN Data