We have two well-used NTP servers. One is our official public server (ntp) and the other (salmon) used to be a public server some years ago, but has now retired from public service (not that that stops people using it). MRTG graphs for these servers are available.
In general the two servers show different patterns for the number of packets they send/receive. For example, salmon used to show quite tall peaks for each weekday, whereas ntp showed much smaller peaks. (These peaks seem to have decreased around November 2004.)
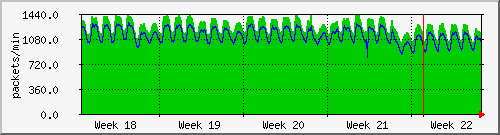
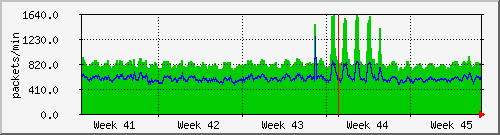
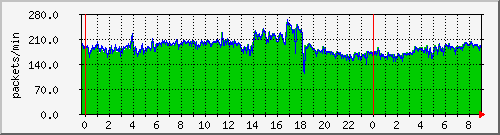
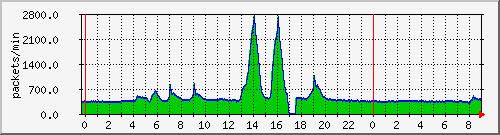
Have a look at the following two plots.
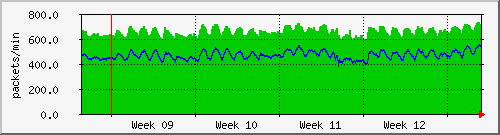
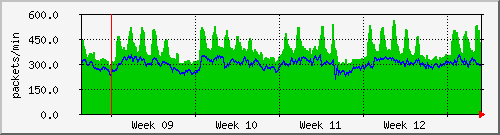
These plots show the packets in/out for ntp and salmon for the weeks surrounding Saint Patrick's day 2004 (the 3rd day of week 11 in these graphs). Saint Patrick's day is a public holiday in Ireland, but not in most other parts of the world. Note that the spike in salmon's load is almost missing on that day. This seems to suggest that a significant number of the clients causing this variable load are actually in Ireland.
The NTP protocol is not supposed to know about daylight saving, as it operates on UTC or TAI, neither of which have the idea of a timezone. However, it seems that some clients do know about daylight savings.
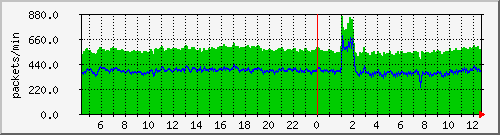
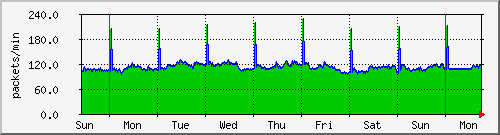
This graph shows the load on our main NTP server just after the change in daylight savings in Europe (26 October 2003). Clearly some clients got a bit excited around the time of the change.
This is the monthly graph for the change in daylight saving change in daylight savings in Europe (October 2005). The first extra peak is about the time of the change, but there seem to be peaks on the following 5 days too.
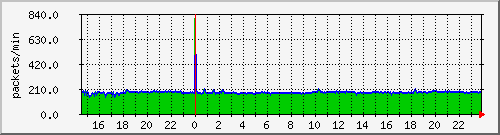
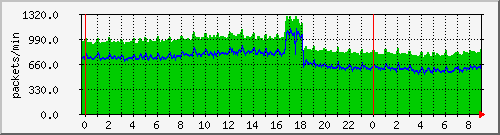
This graph shows the load on one of our sibling NTP servers in TCD. It averages about 120 packets/min, except at 1am, when it bursts to about 800 packets/min! Obviously a group of machines have chosen to set their clocks at 1am (the graphs date from IST, so 1am is midnight GMT).
This graph shows that our NTP server is now seeing the same blip. It will be interesting to see what time it occurs after the daylight savings change.
So, once daylight savings ended the peak has moved to midnight (this shows the load on our sibling NTP server on November 2005).
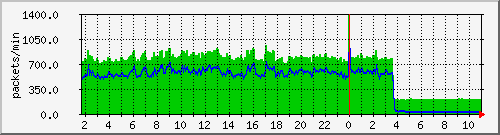
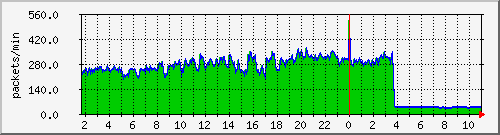
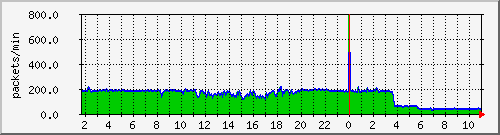
These three graphs show what our load looks like when our external IPv4 connectivity goes away. Only the "ntp" machine supports IPv6 clients, and there aren't very many of these, so this really shows how much of our load is generated by hosts in college.
We had a recent incident where IPv4 packets could get from the Internet to us, but not the other way around. This produced the interesting load patterns between 16:00 and 18:00 below.
As you can see, for one of the servers, the amount of work it was doing increased. I guess that this is because clients were not getting the responses and so were resending the queries. The load on our sibling at this time might not be accurate because they may also have had trouble communicating with us.
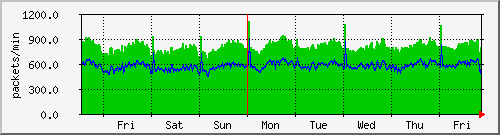
You may note that the load on our sibling looks different in the previous section. It had recently been replaced with new hardware and a newer version of ntpd. They had also joined the NTP pool servers. You can see the before/after for these changes below.
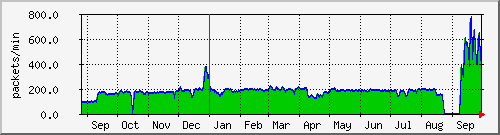
It seems that these changes have been permanent, a year later the load still looks similar.
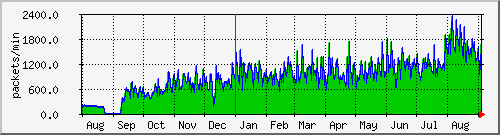
Below, in the middle of week 21, you can see a brief dip in traffic due to a short reconfiguration of the IPv4 connectivity to TCD. Things seem to return to normal quite quickly.