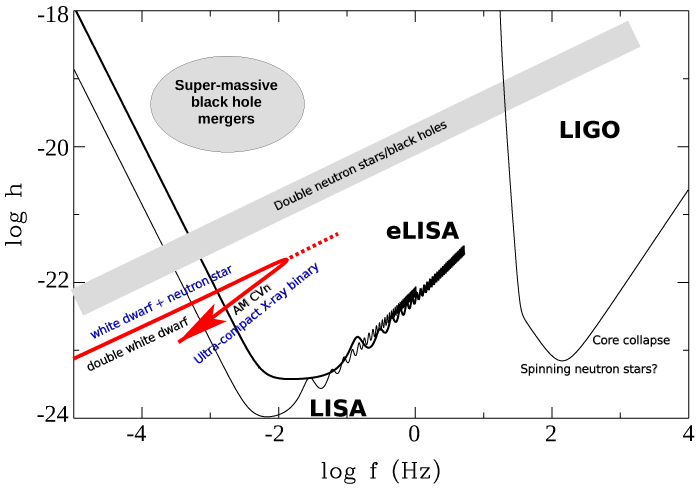
Figure 2: Sensitivity limits of GW detectors and the regions of the  –
– diagram occupied by
some potential GW sources. (Courtesy G. Nelemans).
diagram occupied by
some potential GW sources. (Courtesy G. Nelemans).
– diagram occupied by
some potential GW sources. (Courtesy G. Nelemans).Konstantin A. Postnov and Lev R. Yungelson, "The Evolution of Compact Binary Star Systems",
Living Rev. Relativity, 17 (2014), 3, doi:10.12942/lrr-2014-3, URL (accessed <date>): http://www.livingreviews.org/lrr-2014-3. This work is licensed under a Creative Commons License.
© The author(s), except where otherwise noted.
This work is licensed under a Creative Commons License.
© The author(s), except where otherwise noted.
Living Rev. Relativity, 17 (2014), 3, doi:10.12942/lrr-2014-3, URL (accessed <date>): http://www.livingreviews.org/lrr-2014-3.
This work is licensed under a Creative Commons License.
© The author(s), except where otherwise noted.