 |
|
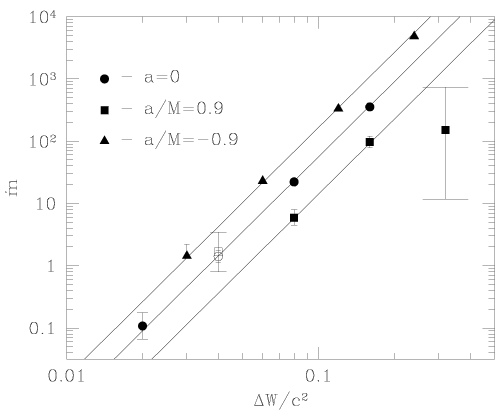
Figure 15: Time-average mass accretion rate
 as a function of the energy gap as a function of the energy gap  for models with
  (circles), (circles),  (squares), and (squares), and  (triangles). The bars
show the variability of (triangles). The bars
show the variability of  . The lines represent the predicted dependencies . The lines represent the predicted dependencies  ,
where ,
where  is the adiabatic index. Image reproduced by permission from [137], copyright by
RAS. is the adiabatic index. Image reproduced by permission from [137], copyright by
RAS. |
- Home
- Articles
sidebar
"Foundations of Black Hole Accretion Disk Theory"
Marek A. Abramowicz and P. Chris Fragile

