A leap second was inserted into the last minute of December 2016. This page contains some information recorded around the leap second. I also recorded some information over the 2005, 2008, 2012 and 2015 Leap Seconds. I have some more raw data to process, which I will I will add as I finish it.
I have a Rugby Radio wired to the DCD pin on a serial port, so I can record if the signal is on or off. Each minute of the signal begins with a 0.5 second on/0.5 second off period. The following graph shows the beginning of each minute around the start of the year.
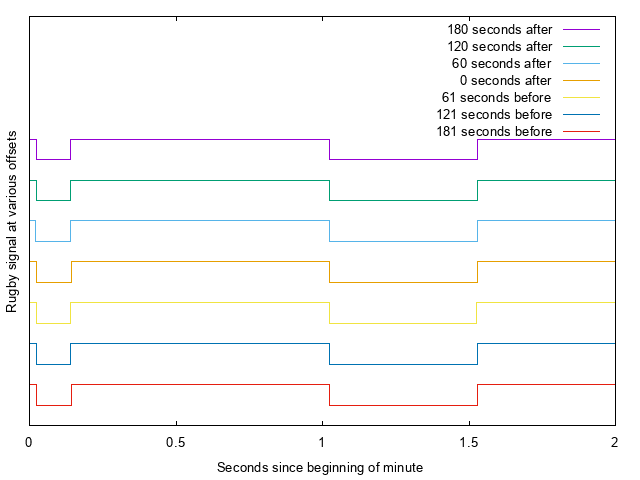
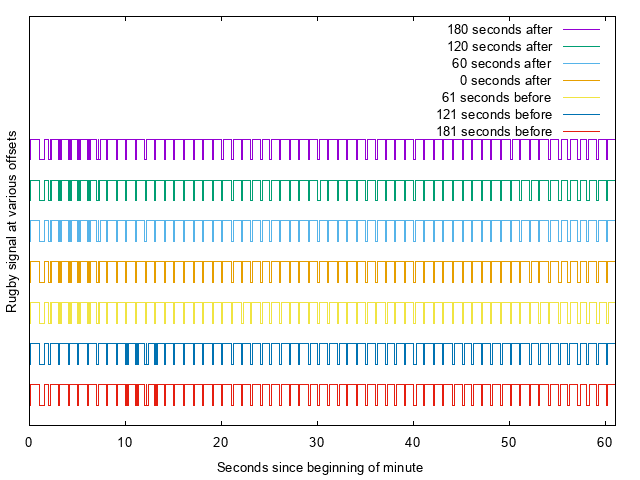
Note that the minutes before the new year began 61, 121 and 181 seconds before the new year, indicating that the last minute had an extra second. The full minute of each signal can be seen here.
Note that the next minute marker is visible at the right hand side of the graph (at second 61) for all the signals but the third from the bottom.
The receiving conditions where good, so I managed to decode the timecodes immediately before and after the leap.
	A: 00000000000000000001011010010110001110100011101100101111110
	B: 00000000111100000000000000000000000000000000000000000001000
	Raw: 31/12/2016 23:59 Sat -400 No-DST
	Ctime: Sat Dec 31 23:59:01 2016

	A: 00000000000000000001011100001000001000000000000000101111110
	B: 11111100000000000000000000000000000000000000000000000111000
	Raw: 1/1/2017 0:01 Sun 600 No-DST
	Ctime: Sun Jan  1 00:01:01 2017
You can see that the DUT value stepped back by 1000ms.
I still have a working Long Wave software radio setup, thanks to Ian Dowse and Juan Domenech Fernandez. I have a new PC for doing my recordings, which seems to work fairly well. Using this, I had a go at recording 6 minutes of 896kSPS radio around every hour transition for a day or so around the leap second.
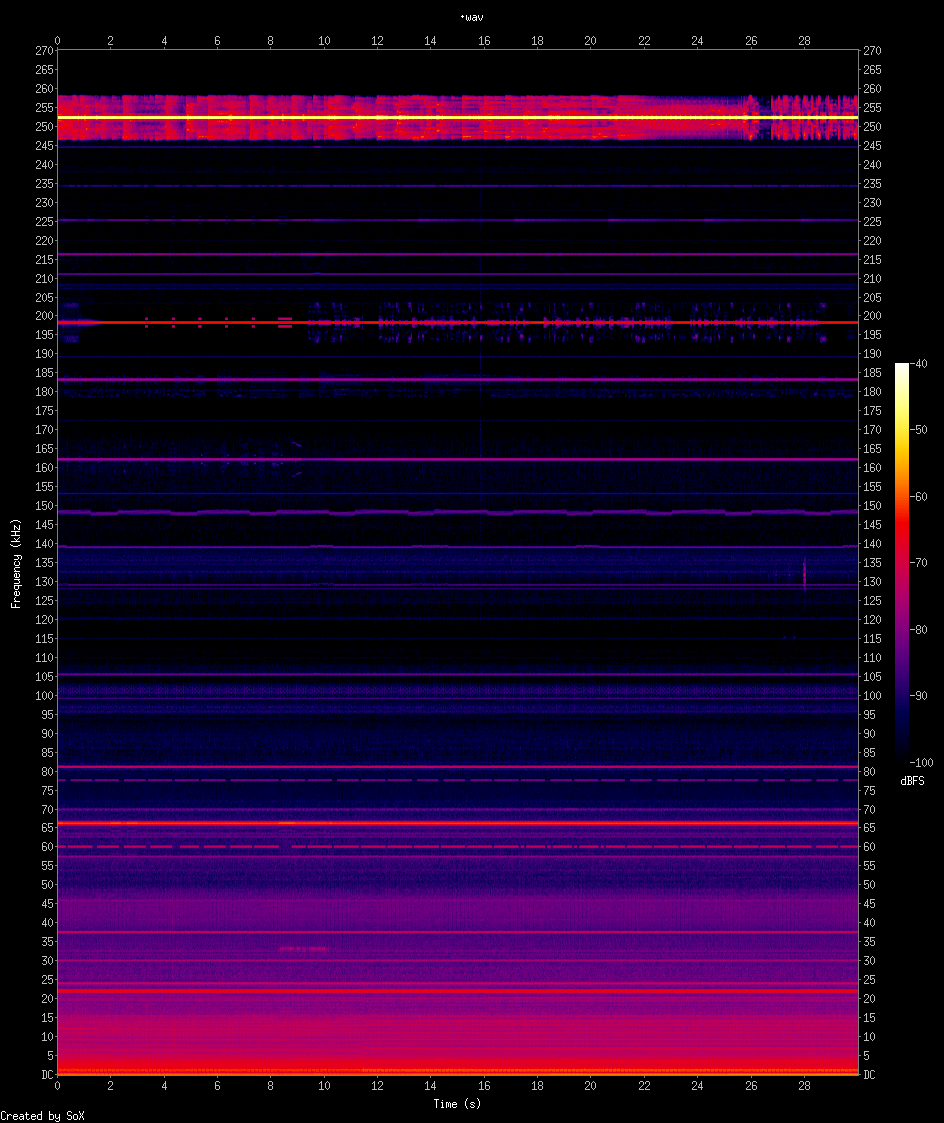
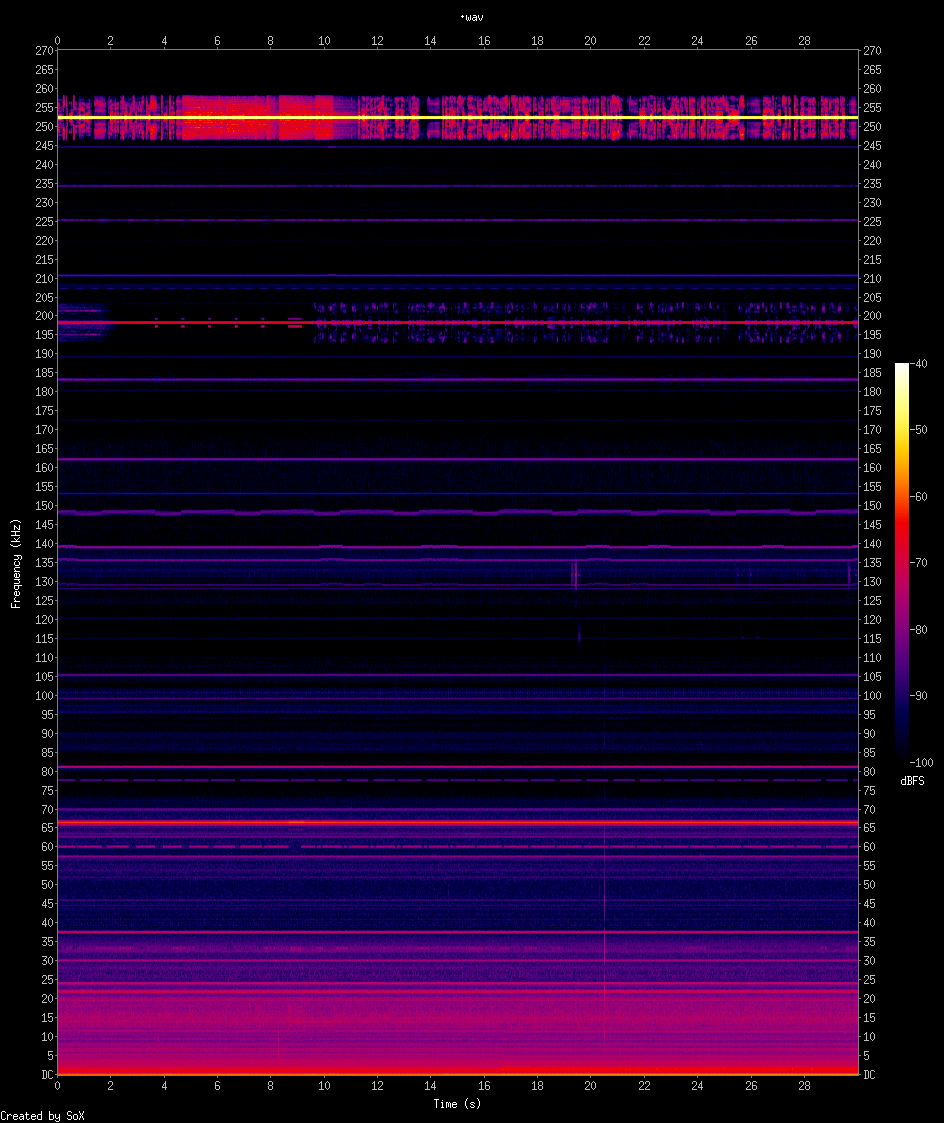
Here are spectrograms for a 30s slice around 23:00, 00:00 and 01:00. These are improved compared to the original spectrograms that I generated, as I've narrowed the frequency range a bit and improved the contrast. There's also a video showing an animated version on YouTube.
Looking at the spectrogram for 00:00, from bottom to top, you can see the MSF ("Rugby") signal to 60kHz with each second beginning with an 0.1s off periods, and the new minute beginning with a 0.5s off period about 10s into the spectrogram. Next, a similar signal can be seen at 77.5kHz (DCF signal from Frankfurt), with a ~2s on period at the same time. Further up, there are AM radio stations for example at 162kHz (France Inter, only the carrier is visible), 183kHz (Europe 1, only the carrier is viable), 198kHz (BBC Radio 4, looks like "bongs" starting at 23:59:60), ... If you check the other two spectrograms you can see things like the pips on BBC Radio 4.
You can see RTE doing a New Year count down during the leap. The RTE long wave signal is type are a few seconds late as the long wave version of the station is a relay of some other version (see my previous attempt to measure this).
If you check the 1am plot, you can clearly see pips on BBC 4, and also it looks like there were pips on the station at about 225kHz. These seem to line up nicely with the DCF and MSF signals.
I have the raw data, if anyone would like it.
NTP warns of impending leap seconds using two bits: 00 means no leap second, 01 means we are adding a leap second, 10 means we are removing a leap second and 11 means the server is unsynchronised.
The NTP project maintains a list of public time servers at stratum 1 and stratum 2. I also made a list of servers included in various NTP Pool servers. Some of these servers will respond when asked for the value of the leap bits. The following is a graph of the proportion of (responding) NTP servers with various values of the leap bits. The vertical line shows when the leap second should have been inserted. For comparison, you can find a page showing similar graphs for each June/December. I've written up a paper describing the 2005-2015 results in detail.
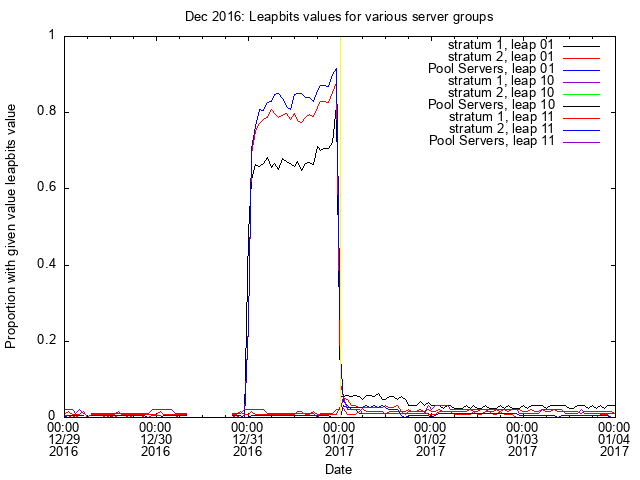
Note, I'm missing a chunk of data from the 30th, as I had a DSL problem. In comparison, this seems a well behaved leap second, though maybe not as good as the 2015 one - there seem to be a number of stratum 1 servers that are still advertising the leap.
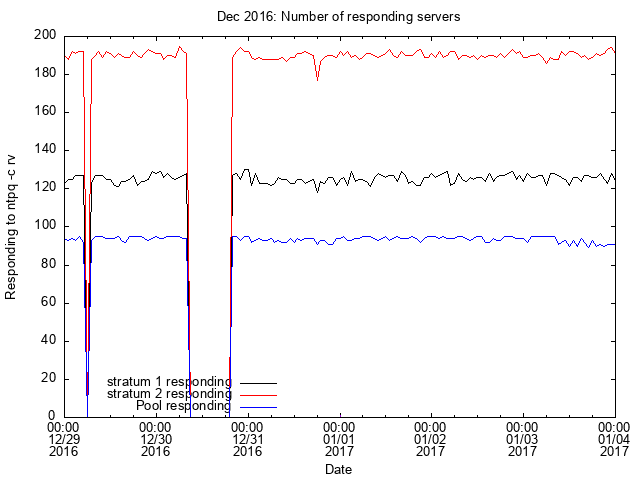
Here's the number of responding servers - you can see it is fairly consistent, except for the DSL outage.
Our Linux machines' kernels logged a message indication the insertion of a leap seconds. These are a mix of physical and virtual machines.
[47967360.163422] Clock: inserting leap second 23:59:60 UTC
[9042714.851223] Clock: inserting leap second 23:59:60 UTC
[8991403.356020] Clock: inserting leap second 23:59:60 UTC
[17683213.652061] Clock: inserting leap second 23:59:60 UTC
[16214770.275679] Clock: inserting leap second 23:59:60 UTC
[17684474.680946] Clock: inserting leap second 23:59:60 UTC
[8430369.724016] Clock: inserting leap second 23:59:60 UTC
[301308.462076] Clock: inserting leap second 23:59:60 UTC
[9042714.851223] Clock: inserting leap second 23:59:60 UTC
[117569.442749] Clock: inserting leap second 23:59:60 UTC
One Apple Airport logged a time change, which I though was related to the leap.
Jan 1 00:05:47 janice ntp: Clock synchronized to network time server ntp.xxx.yyy (adjusted -1 seconds).
However, it seems to log messages like this periodically, so it might or might not be leap related.
The load on our NTP server (in packets per minute) looked like this. The leap happens at midnight on the right hand side of both graphs.
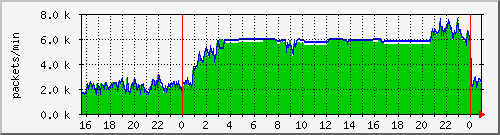
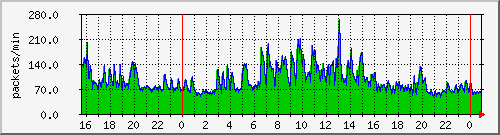
Our main ntp server, which acts as a public server, is shown on the left. It appears that 24 hours before the leap second, we started getting a lot more requests. The increase is so large, that I had to increase our mrtg monitoring limit, so the graph may be truncated before about 21:00. It's not yet clear to me what this is. The secondary NTP server is used less, and it's not clear if there is a change from typical behaviour.
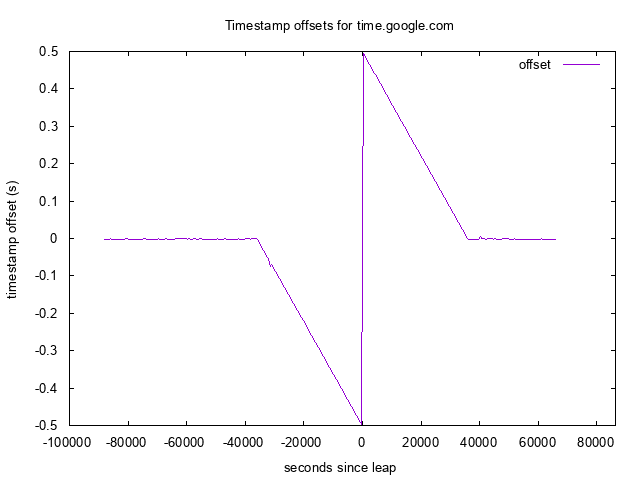
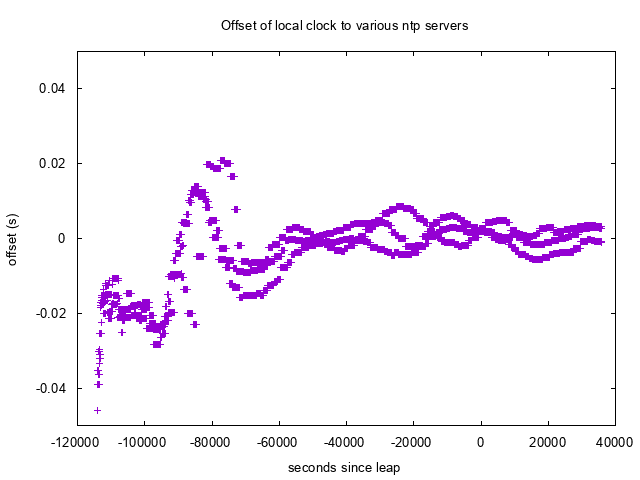
Google decided to smear in the leap second again, however this year they decided to also announce their NTP service as publicly accessible. The graph below shows the offset sampled roughly every 500s to a server on UTC.
Here is the NMEA data received from a Sure GPS unit, which I managed to record more clearly this time. I also used it for my midnight countdown, so I could explicitly see that it outputted 235959.000 twice for the leap second.
$GPGGA,235957.000,XXXX.XXXX,N,00YYY.YYYY,W,2,10,0.85,4.7,M,54.8,M,0000,0000*7C
$GPGSA,A,3,02,16,05,31,25,29,26,23,14,21,,,1.50,0.85,1.24*01
$GPGSV,3,1,12,29,68,073,36,31,63,217,26,26,48,285,28,25,37,103,21*74
$GPGSV,3,2,12,33,28,191,,21,27,162,18,16,19,283,24,23,16,317,18*78
$GPGSV,3,3,12,02,10,033,20,14,09,223,15,05,07,064,17,09,02,350,*7B
$GPRMC,235957.000,A,XXXX.XXXX,N,00YYY.YYYY,W,0.02,219.45,311216,,,D*71
$GPGGA,235958.000,XXXX.XXXX,N,00YYY.YYYY,W,2,9,0.88,4.7,M,54.8,M,0000,0000*46
$GPGSA,A,3,02,16,05,31,25,29,26,14,21,,,,1.44,0.88,1.14*0B
$GPGSV,3,1,12,29,67,072,36,31,63,217,26,26,48,285,28,25,37,103,21*7A
$GPGSV,3,2,12,33,28,191,,21,27,162,18,16,19,283,23,23,16,317,18*7F
$GPGSV,3,3,12,02,10,033,20,14,09,223,15,05,07,064,17,09,02,350,*7B
$GPRMC,235958.000,A,XXXX.XXXX,N,00YYY.YYYY,W,0.05,219.45,311216,,,D*79
$GPGGA,235959.000,XXXX.XXXX,N,00YYY.YYYY,W,2,9,0.88,4.7,M,54.8,M,0000,0000*47
$GPGSA,A,3,02,16,05,31,25,29,26,14,21,,,,1.43,0.88,1.14*0C
$GPGSV,3,1,12,29,67,072,36,31,63,217,26,26,48,285,28,25,37,103,21*7A
$GPGSV,3,2,12,33,28,191,,21,27,162,18,16,19,283,23,23,16,317,17*70
$GPGSV,3,3,12,02,10,033,20,14,09,223,15,05,07,064,17,09,02,350,*7B
$GPRMC,235959.000,A,XXXX.XXXX,N,00YYY.YYYY,W,0.01,219.45,311216,,,D*7C
$GPGGA,235959.000,XXXX.XXXX,N,00YYY.YYYY,W,2,9,0.88,4.7,M,54.8,M,0000,0000*47
$GPGSA,A,3,02,16,05,31,25,29,26,14,21,,,,1.43,0.88,1.14*0C
$GPGSV,3,1,12,29,67,072,36,31,63,217,26,26,48,285,28,25,37,103,20*7B
$GPGSV,3,2,12,49,28,166,,21,27,162,18,16,19,283,23,23,16,317,17*75
$GPGSV,3,3,12,02,10,033,20,14,09,223,15,05,07,064,18,09,02,350,*74
$GPRMC,235959.000,A,XXXX.XXXX,N,00YYY.YYYY,W,0.02,219.45,311216,,,D*7F
$GPGGA,000000.000,XXXX.XXXX,N,00YYY.YYYY,W,2,9,0.84,4.7,M,54.8,M,0000,0000*4A
$GPGSA,A,3,02,05,31,25,29,26,23,14,21,,,,1.42,0.84,1.14*07
$GPGSV,3,1,12,29,67,072,36,31,63,217,26,26,48,285,28,25,37,103,20*7B
$GPGSV,3,2,12,49,28,166,,21,27,162,18,16,19,283,,23,16,317,17*74
$GPGSV,3,3,12,02,10,033,20,14,09,223,15,05,07,064,18,09,02,350,*74
$GPRMC,000000.000,A,XXXX.XXXX,N,00YYY.YYYY,W,0.01,219.45,010117,,,D*7D
$GPGGA,000001.000,XXXX.XXXX,N,00YYY.YYYY,W,2,8,1.01,4.7,M,54.8,M,0000,0000*46
$GPGSA,A,3,02,05,31,25,29,26,14,21,,,,,1.55,1.01,1.17*0F
$GPGSV,3,1,12,29,67,072,36,31,63,217,26,26,48,285,29,25,37,103,20*7A
$GPGSV,3,2,12,49,28,166,,21,27,162,18,16,19,283,,23,16,317,17*74
$GPGSV,3,3,12,02,10,033,20,14,09,223,15,05,07,064,19,09,02,350,*75
$GPRMC,000001.000,A,XXXX.XXXX,N,00YYY.YYYY,W,0.04,219.45,010117,,,D*79
Wayne Sullivan also provided GPS output from a ublox MAX-M8q, which shows the leap second as 235960.00.
$GNRMC,235959.00,A,XXXX.XXXXX,N,00YYY.YYYY6,W,0.059,,311216,,,D*7C
$GNVTG,,T,,M,0.059,N,0.109,K,D*3C
$GNGGA,235959.00,XXXX.XXXXX,N,00YYY.YYYY6,W,2,12,0.78,60.8,M,52.9,M,,0000*60
$GNGSA,A,3,02,25,26,14,16,23,21,31,29,,,,1.27,0.78,1.00*1E
$GNGSA,A,3,88,87,86,76,77,,,,,,,,1.27,0.78,1.00*16
$GPGSV,4,1,14,02,10,033,26,05,07,064,22,09,02,350,,12,00,101,11*70
$GPGSV,4,2,14,14,09,223,38,16,19,283,30,21,27,162,43,23,16,318,23*72
$GPGSV,4,3,14,25,37,102,36,26,48,285,41,29,68,073,40,31,64,217,40*79
$GPGSV,4,4,14,33,29,191,41,39,23,143,33*76
$GLGSV,3,1,09,68,04,298,,69,13,344,,70,06,036,,76,35,139,32*60
$GLGSV,3,2,09,77,84,302,30,78,25,317,,86,49,044,32,87,66,193,41*6D
$GLGSV,3,3,09,88,18,210,34*51
$GNGLL,XXXX.XXXXX,N,00YYY.YYYY6,W,235959.00,A,D*6F
$GNRMC,235960.00,A,XXXX.XXXXX,N,00YYY.YYYY1,W,0.018,,311216,,,D*73
$GNVTG,,T,,M,0.018,N,0.034,K,D*36
$GNGGA,235960.00,XXXX.XXXXX,N,00YYY.YYYY1,W,2,12,0.78,61.0,M,52.9,M,,0000*63
$GNGSA,A,3,02,25,26,14,16,23,21,31,29,,,,1.27,0.78,1.00*1E
$GNGSA,A,3,88,87,86,76,77,,,,,,,,1.27,0.78,1.00*16
$GPGSV,4,1,14,02,10,033,26,05,07,064,21,09,02,350,,12,00,101,08*7B
$GPGSV,4,2,14,14,09,223,39,16,19,283,30,21,27,162,43,23,16,318,22*72
$GPGSV,4,3,14,25,37,102,36,26,48,285,41,29,68,073,40,31,64,217,40*79
$GPGSV,4,4,14,33,29,191,41,39,23,143,33*76
$GLGSV,3,1,09,68,04,298,,69,13,344,,70,06,036,,76,35,139,32*60
$GLGSV,3,2,09,77,84,302,30,78,25,317,,86,49,044,32,87,66,193,41*6D
$GLGSV,3,3,09,88,18,210,34*51
$GNGLL,XXXX.XXXXX,N,00YYY.YYYY1,W,235960.00,A,D*65
$GNRMC,000000.00,A,XXXX.XXXXX,N,00YYY.YYYY6,W,0.021,,010117,,,D*78
DVB transmits some timing information (in PID 20), but timestamps only come to one second precision, and often seem to be late. I had a go at recording the timing packets that arrived when a DVB-S card was tuned to BBC One NI (Astra2 10817 MHz V, vpid 0x15e0, apid 0x15e1, sid 0x2898), WDR Aachen (Astra 12603 MHz H, vpid 0x0d49, apid 0x0d4a, sid 0x6f76) and when a DVB-T card was tuned to RTE 1 (770 MHz, vpid 0x0835, apid 0x0899). Around the leap second, ntp indicated that the machine recording was within tens of ms of UTC.
The purple and green points show the difference between the received timestamp (only includes 1s accuracy) and the timestamp of the machine (to ms accuracy). The cyan and orange lines show rough upper and lower bounds derived by looking at two packets that arrive with the same timestamp. First let's look at the BBC graphs:
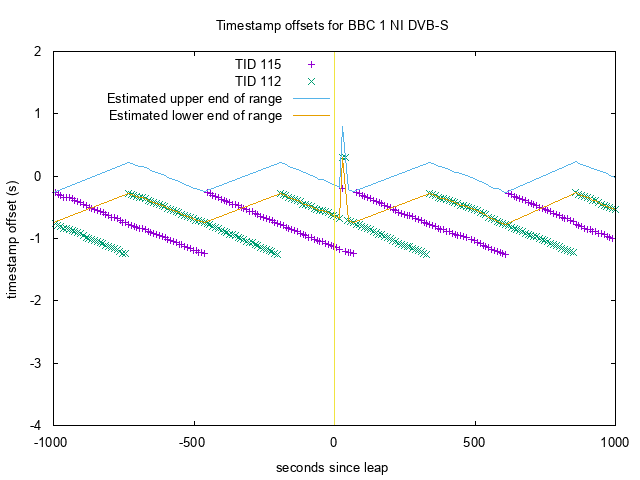
There is a jump, just after the leap second. Zooming out a bit, we see the following.
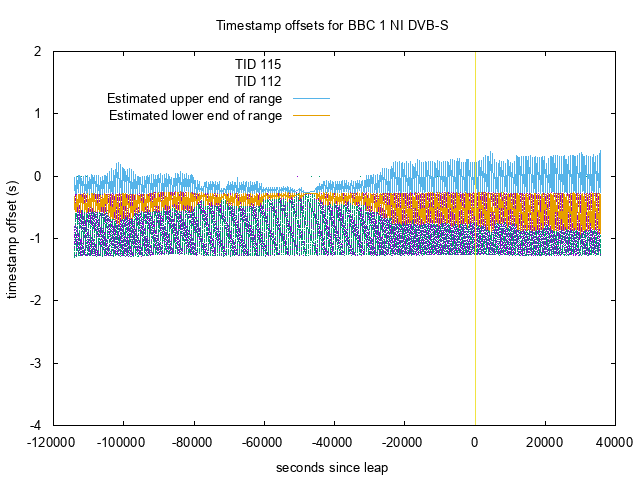
So, we see there is a spike at the leap, but there are other spikes, so it's possible this is a non-leap related spike. Now, let's look at the WDR graph:
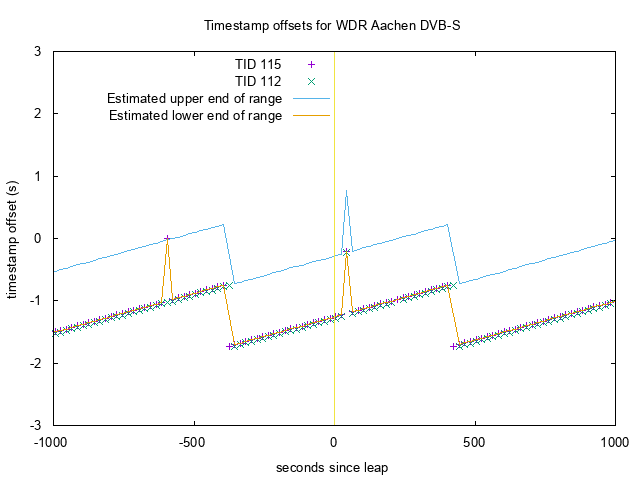
Again, there is a step after the leap, but also one while before and one a while after. However, if we look over a longer timescale.
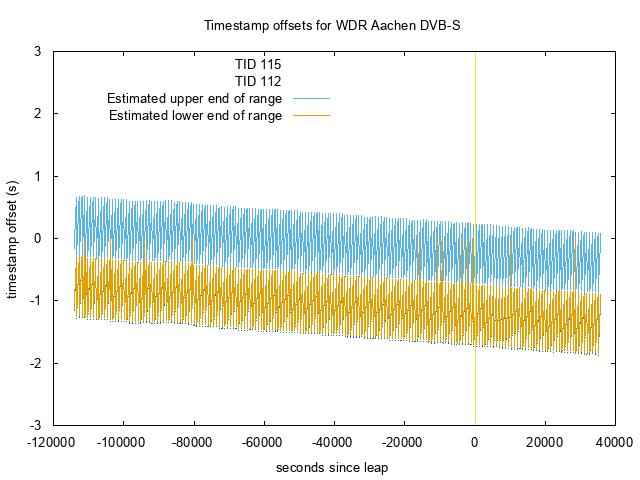
It seems likely that this was somehow leap induced offset. Finally, let's have a look at the RTE graphs.
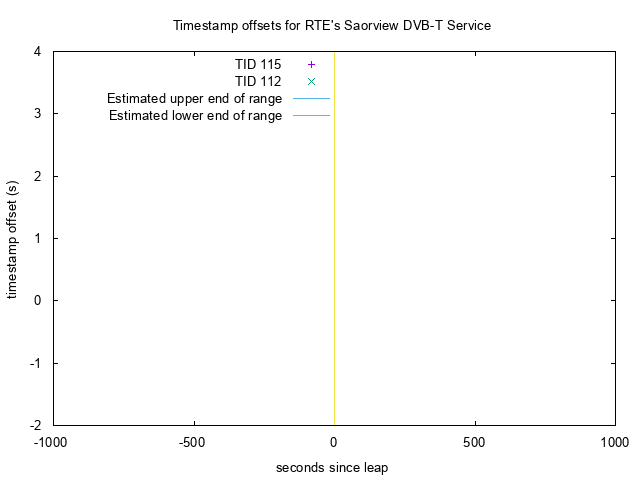
Weird - no points! If we zoom out.
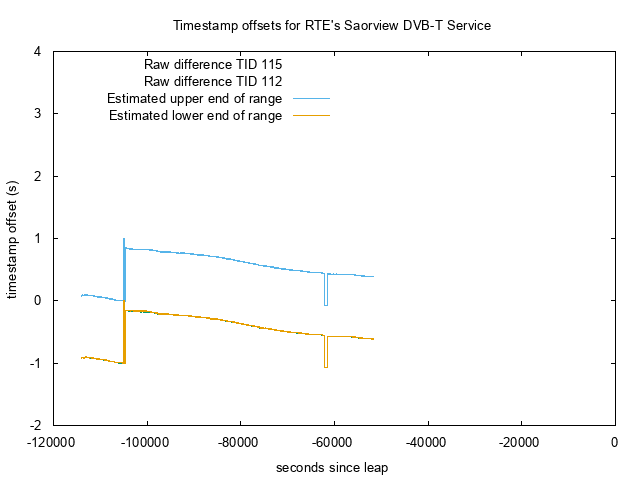
It seems I lost the signal a few hours before the leap! Further investigation shows that my new TV decoder box only forwards the DVB-T signal if it is turned on.
The mains in Ireland is usually maintained at about 50Hz. When I last asked, they aimed to keep it between 49.9 and 50.1Hz over roughly 5s periods, and aim to keep the number of cycles correct over long periods. When I last heard, the Rugby signal used to be the benchmark against which the mains was measured.
To test what the mains did over the leap, I built a small loop of wire and connected it to the mic connector on a sound card. I left the loop near some power cables, in the hope it would pick up some mains hum. I then processed this in 60s chunks to look for a peak in the amplitude of the Fourier Transform between 49 and 51Hz.
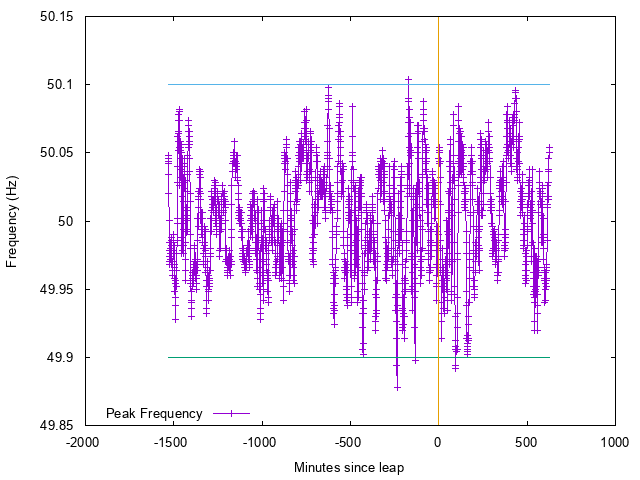
The results are shown above, with one point per 60s worth of samples, horizontal lines showing 49.9Hz and 50.1Hz and the leap shown with a vertical line. There doesn't seem to be much going on around the leap.
Of course, one concern is that the sample rate of the sound card may be varying, and contributing to the variability in the mains. While this data was being recorded, I noted how fast samples were being written to the disk against the system clock, which was controlled by NTP. Unfortunately, this is quantised to disk blocks, which aren't quite the same size as the 8000*16bit samples per second being recorded. However, if you smooth over about 512 seconds, you'll get about 500 8KB blocks being written every interval, and you can look for variations.
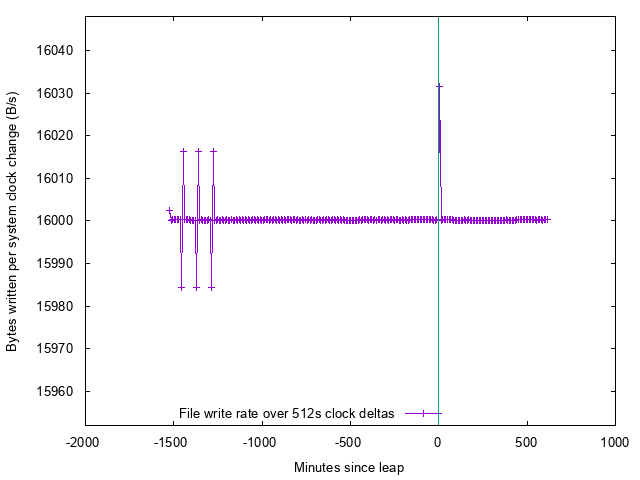
This is plotted on the same relative scale as the graph above, and it looks much smoother. The notable steps are at the start (which I think is some jitter due to initialisation), there are several paired spikes (blocks being written just in the wrong 512s interval) and a single spike at the leap. Overall, it looks like the sample rate from the sound card is pretty stable.
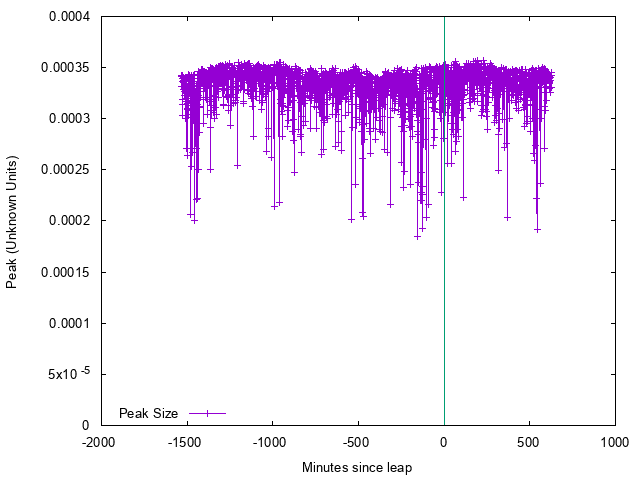
Finally, it's probably worth checking that the amplitude of the peak that we consider to be the mains is relatively constant. Since the loop is just picking up mains hum from the air, it's possible I'm just picking up noise. It seems it is relatively constant.
Here are some links, found via the LEAPSECs mailing list, the time-nuts mailing list and twitter.